What Are KPIs for Sales (and What Does KPI Stand for in Marketing)? Everything You Need to Know
Dashboards are packed with numbers, but not all numbers are KPIs. If you've been asking yourself "What is KPI in sales and marketing?", here’s what it means — and why copying a list of KPIs from the internet might not get you the results you're looking for.

Sales and marketing teams love numbers. They fill dashboards, reports, and slide decks with them. Leads, clicks, conversions, calls, demos, deals, revenue — the list goes on. But when someone asks the simple question, “So, in our team, what are KPIs for sales?”, things often get awkward.
The average sales or marketing team might confuse KPIs with any old indicator. Others think KPIs are those big financial numbers the CEO rattles off at the quarterly update. And the question “What does KPI stand for in marketing?” gets asked more often than you’d think.
So, let’s clear this up. This guide is going to explain what 'KPI' stands for and unpack exactly what KPIs are for sales and marketing, how they differ from metrics, why they matter, and give you some examples. You’ll also get a practical list of KPIs for sales, and by the end you’ll see why a simple list isn’t enough — you need structure and strategy if you want your KPIs to drive results.
What Does KPI Stand for in Marketing?
Let’s start with the basics: KPI = Key Performance Indicator.
In this industry, a KPI is a measurable value that shows whether your campaigns and activities are helping you achieve your goals. Sounds straightforward enough, but the important word here is “key.”
Marketing is overflowing with data. Website traffic, social media followers, email opens, ad impressions, bounce rates, click-through rates — you can measure almost everything. But not everything matters.
A metric is just a measure. A Key Performance Indicator is a measure that truly indicates progress against your strategy.
Why Key Indicators Matter in Marketing
- Clarity – They stop you chasing vanity numbers and keep the focus on real results.
- Alignment – They tie your activity to business goals like revenue, pipeline, and ROI.
- Accountability – They define success so everyone knows what’s expected.
Common Mistakes With Performance Indicators
- Mistaking activity for outcomes ❌ Counting likes or followers without asking whether they actually generate leads or sales.
- Too many indicators ❌ A list of 150 “KPIs” isn’t key, it’s clutter.
- Ignoring context ❌ Reporting a 5% conversion rate without knowing whether that’s good or bad in your industry.
So when someone asks “What does KPI stand for in marketing?”, the best answer isn’t just “Key Performance Indicator.”
It’s “the handful of numbers that prove whether your marketing is moving the business toward achieving its goals.”
What Are KPIs for Sales?
If marketing performance indicators are about generating demand, sales KPIs are about converting that demand into revenue.
Sales teams are also drowning in data. Calls made, emails sent, demos booked, proposals submitted, deals won, deals lost, revenue booked — it’s all measurable. But again, not everything that can be measured is key.
A sales Key Performance Indicator is one of the critical few measures that indicate whether your sales team is on track to hit its goals.
The Sales Process in Key Metric Form
Think of the sales funnel as a chain:
- Activities → calls, emails, meetings.
- Conversion points → leads to opportunities, opportunities to closed deals.
- Outcomes → revenue, average deal size, win rate.
Each link in that chain can be measured, but only a few points really matter as key indicators. To illustrate:
- Calls made might be a metric.
- Win rate is more likely a key indicator, because it directly impacts revenue and efficiency.
Why Companies Get Sales Performance Indicators Wrong
- They focus on activity measures (“number of calls”) at the expense of outcome measures (“revenue per rep”).
- They measure everything equally instead of prioritising.
- They don’t link sales performance indicators to strategy (e.g., pushing for new sector growth vs. maximising existing accounts).
So when someone asks “What are KPIs for sales?”, the practical answer is: the handful of sales measures that show whether your team is turning opportunities into revenue, efficiently and effectively.
What is KPI in Sales and Marketing?
Here’s where it gets interesting. Sales and marketing don’t live in separate worlds. They’re two sides of the same growth coin.
Sales and marketing KPIs need to be connected. Otherwise, you get the classic blame game:
- Marketing says, “We delivered 1,000 leads this quarter.”
- Sales says, “Yes, but none of them were qualified.”
- Leadership says, “Revenue is down. Who’s responsible?”
When key indicators aren’t linked, marketing optimises for volume while sales struggles with quality. The result: frustration and missed targets.
A joined-up approach means:
- Marketing key measures should flow naturally into sales key measures.
- Sales should feedback into marketing to refine targeting and quality.
- Both should align with overall business key measures (growth, profitability, market share).
In other words, KPIs in sales and marketing should form a connected system, not two disconnected dashboards.

Sales and Marketing Metrics vs. Sales and Marketing KPIs
Let’s draw a clean line between the two:
- Metrics = raw numbers you can track.
- KPIs = the critical few numbers that really tell you whether you’re winning.
Think of it like cooking. Metrics are all the ingredients you could possibly throw into a pan. Key indicators are the actual dish you serve — the meaningful result.
And what makes a metric a KPI really comes down to your specific strategy.
Example: Marketing Metric vs KPI
- Metric: Number of emails sent.
- KPI: Email click-through rate.
Example: Sales Metric vs KPI
- Metric: Number of calls made.
- KPI: Win rate (% of opportunities closed).
Both metrics and KPIs are useful, but don’t confuse them. Metrics can inform decisions. KPIs drive decisions.
How to Choose the Right KPIs (and Avoid the Random List Trap)
Before we dive into some illustrative performance indicators, let’s talk about how you should actually choose them. Because grabbing a random “list of KPIs for sales” off the internet and trying to apply it straight to your business is, frankly, a waste of time.
Here’s why: key indicators only work when they’re directly linked to your strategic objectives. If they’re not tied to your goals, they quickly turn into “numbers for numbers’ sake.” (Think slaving away for hours or days on end under pressure to produce a list of key indicators for an important meeting only to then have the boss glance briefly at two or three numbers and then toss the report aside.)
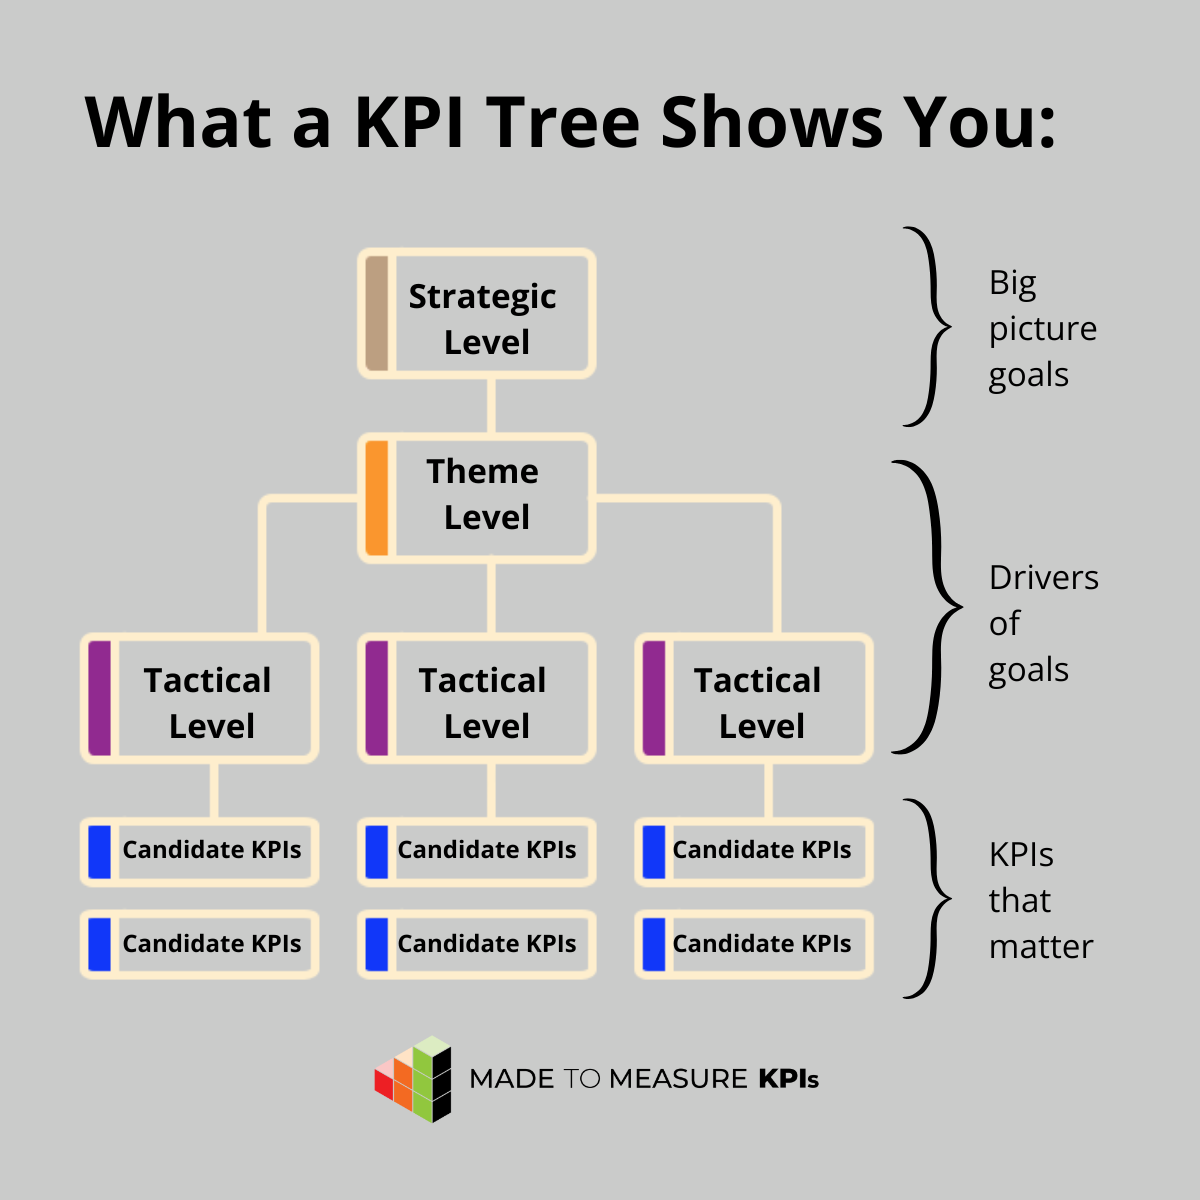
The best way to do this is with a KPI Tree. A KPI Tree starts with your big strategic objectives, breaks them into smaller goals, and then maps out the performance indicators that really matter at each level. That way, you’re not tracking what’s easy or popular — you’re tracking what’s critical to achieving your goals.
What Happens When You Just Pick Random Key Measures?
If you’ve ever seen performance indicators chosen without strategy, you’ll recognise some of these headaches:
- Endless reporting with no clear insight.
- Teams chasing numbers that don’t actually improve results.
- Conflicting measures between departments (“marketing says it’s winning, sales says it’s losing”).
- Dashboards stuffed with vanity measures no one reads.
- Wasted time debating what the numbers even mean.
Sound familiar? That’s what happens when performance indicators aren’t anchored to business objectives.
A Smarter Shortcut
Now, building a KPI Tree from scratch takes time and expertise. The good news? We’ve done the heavy lifting for you.
Our KPI Packs come with ready-made KPI Trees for key sales and marketing indicators. That means you can skip the blank-page struggle and go straight to the important bit: choosing the most relevant performance indicators for your strategy.
Here’s how we put it in the KPI Pack itself:
“To make the best use of this guide, you should think about your business objectives (the outcome you want your performance indicators to help you achieve), read through the KPIs on offer, select the ones relevant to your objectives then implement them. Nice and simple.”
With the KPI Pack, you’re not just getting a shopping list of measures. You’re getting a structured system that makes it obvious which sales data and key measures are critical for your specific objectives.
Sales and Marketing KPI Examples
Now that you know key measures should always be chosen with your strategic objectives in mind — and ideally structured through a KPI Tree — let’s look at some practical illustrations.
The following illustrations aren’t just plucked from thin air. They come straight from our Sales & Marketing KPI Pack, which includes 144 KPIs organised into 9 ready-to-go KPI Trees. Each key indicator is linked to the relevant area of sales or marketing so you can see exactly how it ties back to strategy.
Here are a few sales and marketing KPI examples you'd find in the pack:
Sales KPI Examples
Here are just a few sales activities you may want to track, depending on your strategy:
Key indicator: Lead Conversion Rate
- What it is: The percentage of leads that turn into paying customers.
- Why it matters: Shows how effective your sales process is at moving prospects through the funnel.
Key indicator: Original Contract Hours Sold
- What it is: The total number of billable hours agreed in initial sales contracts.
- Why it matters: Helps measure revenue potential and the quality of contracts secured.
Key indicator: Product Basket Price Comparison
- What it is: The comparison of your product bundle price against competitors’ bundles.
- Why it matters: Highlights competitiveness and pricing strategy effectiveness.
Key indicator: Paid Referrals Conversion Rate
- What it is: The percentage of referred leads (through paid referral schemes) that become customers.
- Why it matters: Shows the ROI of referral programmes and overall quality of referred leads.
Key indicator: Average Person Hours per Contract
- What it is: The average labour hours required to deliver on a customer contract.
- Why it matters: Tracks efficiency and resource use, ensuring profitability is maintained.
Marketing KPI Examples
Here are just a few marketing activities you may want to track, depending on your strategy:
Key indicator: Average Spend per 1,000 Visitors
- What it is: Marketing spend divided by every 1,000 website visitors.
- Why it matters: Measures efficiency of website traffic generation and spend effectiveness.
Key indicator: Total Website Sales Value
- What it is: The total revenue generated directly through your website.
- Why it matters: A clear indicator of how well your website drives real sales.
Key indicator: Cart Abandon Rate
- What it is: The percentage of shoppers who add items to their cart but don’t complete checkout.
- Why it matters: Reveals friction points in the buying process and lost sales opportunities.
Key indicator: In-Page Ad Click Rate
- What it is: The percentage of visitors clicking ads placed within your web pages.
- Why it matters: Shows how engaging your ad placements are and whether they drive action.
Key indicator: Return on Marketing Investment (ROMI)
- What it is: Revenue generated compared to marketing spend.
- Why it matters: Proves whether your marketing is worth the money.

List of KPIs for Sales
Here’s a structured list of KPIs for sales, grouped by category as you would find them within our Sales & Marketing KPI Pack for clarity:
S1 Sales - Value, Activity & Results
- Lead conversion rate
- Average value per sale
- New qualified leads each month
S2 Sales - Hourly Billing
- Average billing rate per hour
- Market rate ratio
S3 Sales - Words
- Average fee per 1,000 words
- Contract extension ratio
S4 Sales - Contract Services
- Original contract days sold
- Contract extension ratio
S5 Sales - Pricing
- Product basket price comparison
- Average competitor selling price
Also Included in the KPI Pack:
- S6 Sales - Advertising, Pay Per Click & Organic Traffic
- S7 Sales - Referrals
- S8 Sales - Proposals & Contracts
Remember: this isn’t about tracking all of them. Pick the few that best fit your sales strategy.
Sales Targets vs. Sales KPIs
Many sales teams live and breathe sales targets. Hitting quota, smashing the sales cycle, beating last quarter, locking in sales growth — it’s the daily grind.
And while targets can help focus energy, they don’t always deliver the greatest positive impact for the individual AND the organisation.
Here’s the thing: sales targets and sales KPIs are NOT the same.
- KPIs measure the performance of your sales activities and team performance.
- Targets are goals set against those KPIs.
The two should never be designed together. First, choose the most relevant KPIs. Then, and only then, set targets that help sales without creating incentives to cheat or burnout.
We’ve got loads of free resources on how to fix targets and incentives, but a good place to start is our blog post: 👉 10 KPI targets that kill performance.
Why Most KPI Lists Fail
Google “list of KPIs for sales” and you’ll find hundreds. Many are copy-paste jobs stuffed with every indicator under the sun. But most of them have three big problems:
- They’re too long. No team can track 90+ indicators effectively.
- They’re too generic. An indicator that works for SaaS may not work for manufacturing.
- They lack structure. Without linking key indicators to objectives, you get noise, not insight.
A KPI list on its own is like a shopping list without a recipe. You’ve got ingredients, but no idea how to cook them into something useful.
Sales leaders don’t need endless spreadsheets; they need a focused set of measures that link directly to strategy.
The Smarter Way to Use KPIs in Sales and Marketing
Here’s the good news: there is a better way.
Instead of treating key indicators as a random collection of measures, you can use a KPI Tree to break down your strategic objectives into performance indicators that matter to your business.
A KPI Tree makes it easier to track sales without drowning in irrelevant numbers.
What’s a KPI Tree?
A KPI Tree breaks down your big strategic goals into smaller objectives and drivers, and then links those to the right key measures. It gives you a logical, visual structure.
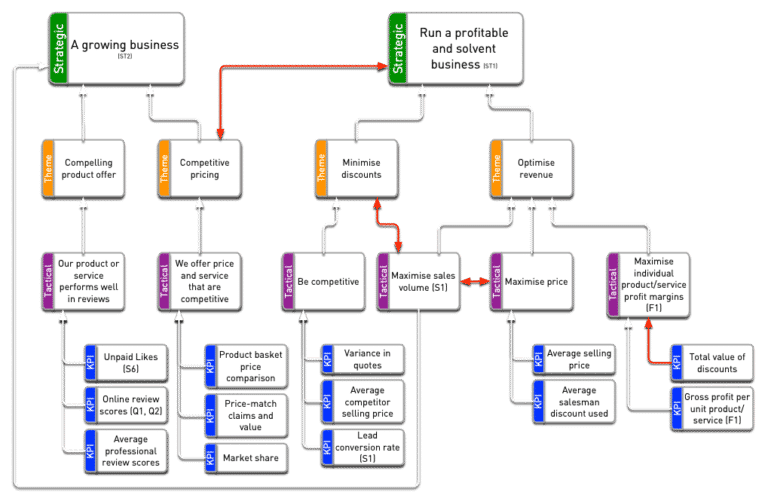
Here's a sample of a KPI Tree:
It stops you from drowning in irrelevant indicators, visually lays out how your KPIs link to your strategy, and keeps everyone aligned.
And here’s the kicker: our Sales & Marketing KPI Pack does the heavy lifting for you. It comes with:
- 9 pre-built KPI Trees for Web Marketing and Sales
- 144 KPIs linked directly to your strategic objectives
- 80 ready-to-use KPI definitions to make implementation simple
- Step-by-step guidance to help you choose the right key measures
- Bonus: KPI Tree Cheat Sheet for an at-a-glance overview
So if you want to go beyond lists and actually implement KPIs that drive sales and marketing success, the KPI Pack is your shortcut.
Conclusion
So, let’s bring it home.
- What does KPI refer to in marketing? Key Performance Indicator — the vital few numbers that prove marketing is moving the business forward.
- What are KPIs for sales? The handful of indicators that show whether your sales team is efficiently converting leads and opportunities into revenue.
- What’s the difference between KPIs and metrics? Metrics are everything you can measure; KPIs are the metrics that really matter for your specific goals.
- What’s the smartest way to use them? Not as a big list, but as part of a KPI Tree that connects sales and marketing key measures to business outcomes.
The right KPIs turn sales efforts into measurable progress instead of guesswork. Sales managers and sales leaders must learn to focus on the critical sales KPIs that drive growth, not the dozens that simply generate noise.
If you’re serious about making sales and marketing key performance indicators work for you, don’t just collect metrics — get the structure, tools, and ready-to-go KPIs that actually deliver results.
👉 Check out the Sales & Marketing KPI Pack and start turning numbers into performance.
FAQs About Sales and Marketing KPIs
Key indicators for sales are the most important indicators that show whether your sales team is effectively turning opportunities into revenue. Examples include lead conversion rate, average value per sale, and new qualified leads each month. Tracking sales KPIs is how sales leaders can ensure progress against sales strategies and effectiveness of sales work.


