What is Agile Analytics?

Every organisation I've worked with over the last few years seems to feature an embattled analytics team doing their best to meet the endless demands of the business and business owners that are depressed and frustrated by the the slow turnaround on any requests. It's easy to assume that this problem is just a result of not enough resources, but the issues run deeper than this. The problem has been created by a silo approach and a parent-child relationship between the business and the analytics team. This problem is is remarkably similar to the one identified many years ago in software development, a problem which gave birth to Agile and DevOps.
Using the tooling developed for Agile, but fine-tuning them for the specifically for analytics, we can create a faster, slicker and more rewarding analytics process. That approach is called Flexible Agile Analytics for Business, FAAB for short.
What are the benefits of Agile Analytics?
The benefits of FAAB are similar to those from classic agile…
- Improved quality
- Focus on business outcomes and value
- Stakeholder engagement
- Transparency
- Early and predictable outputs
- Predictable costs and scheduling
- Flexibility to pivot during the process
So, how does FAAB work?
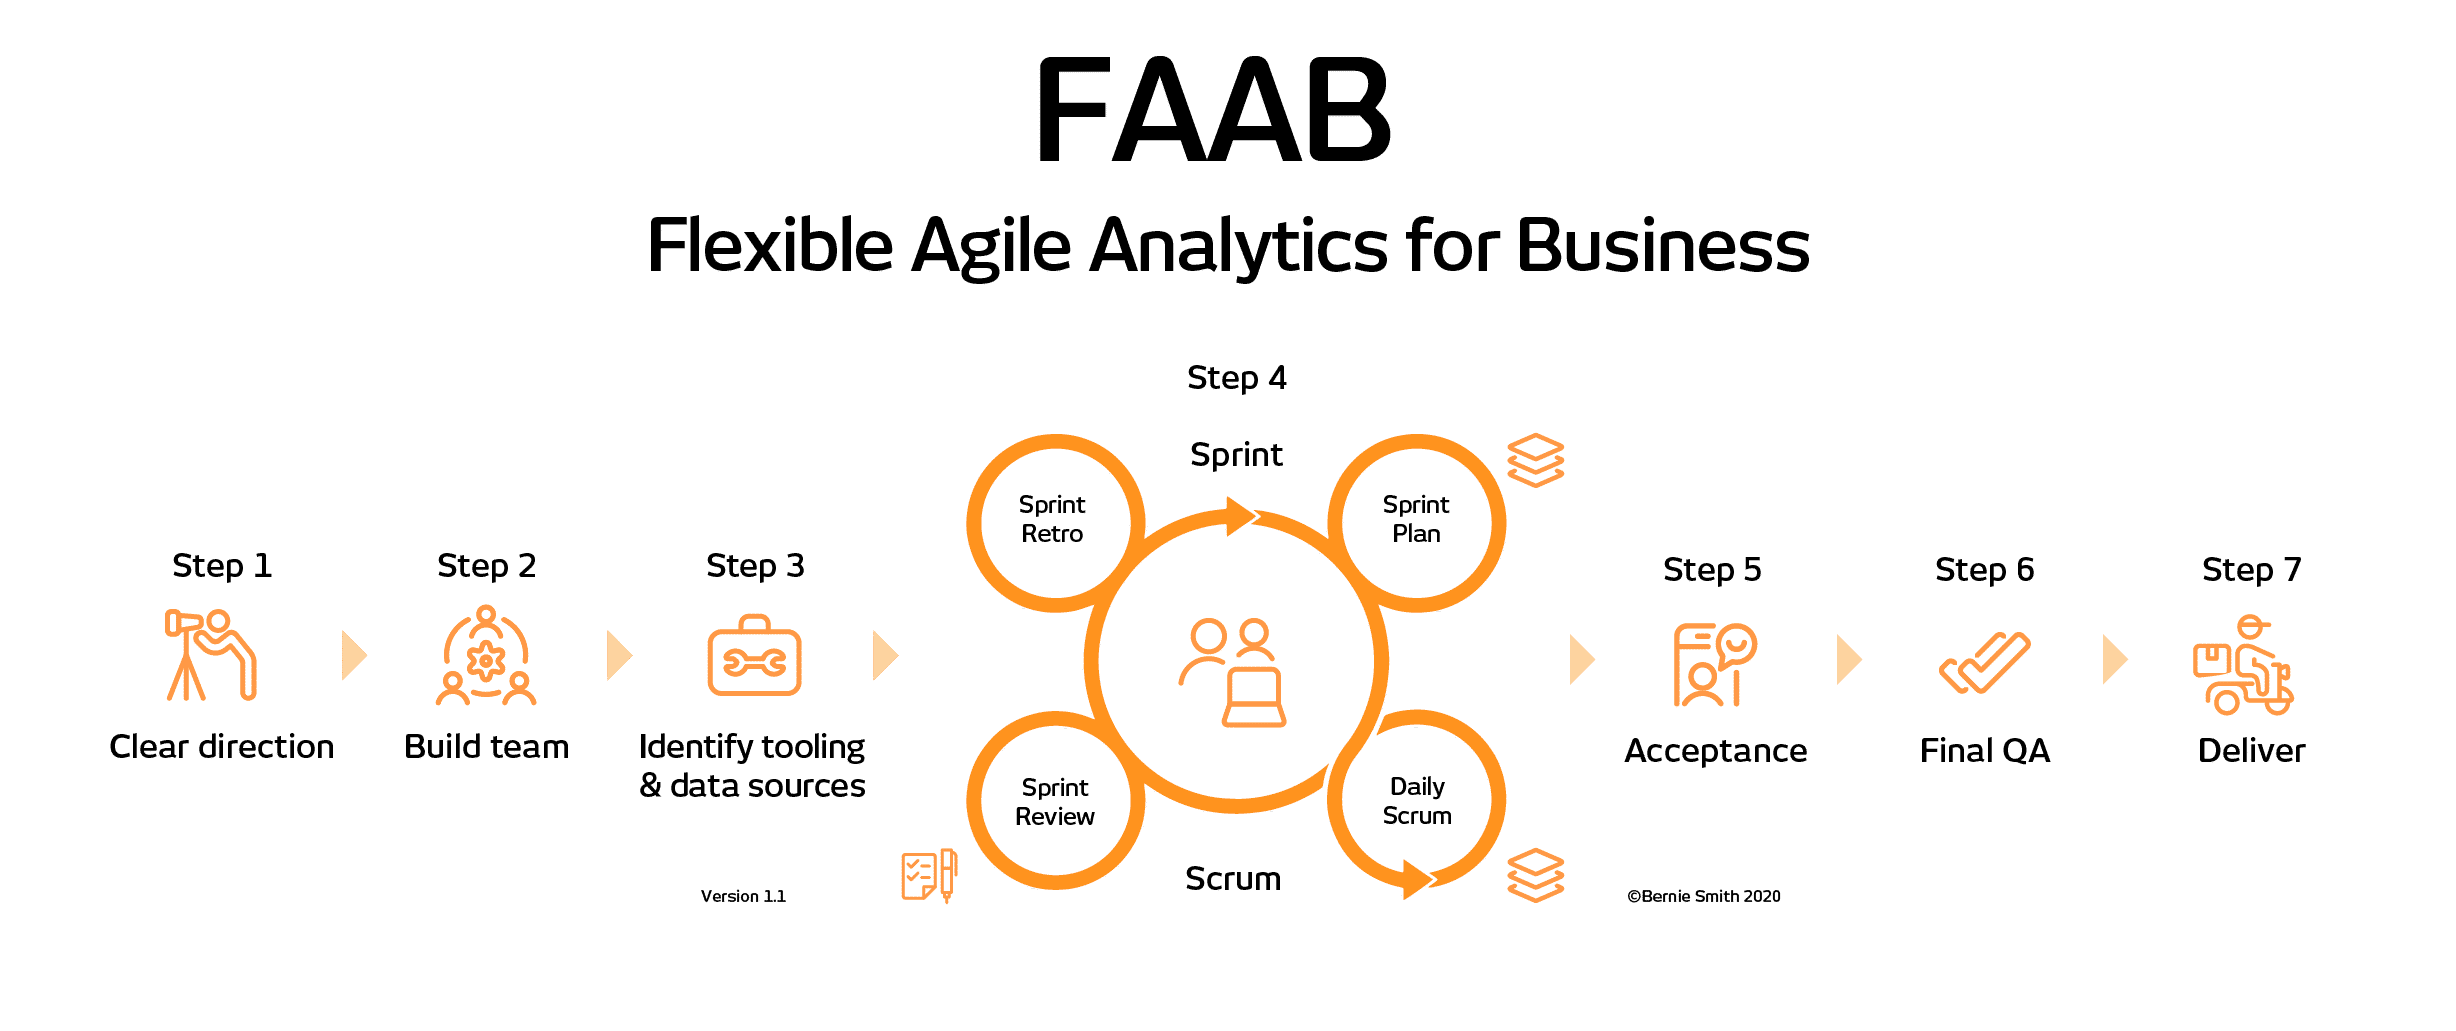
FAAB - Flexible Agile Analytics for Business

Step 1: Clear direction
Let’s use the analogy of planning a road trip from Boston to Seattle. Using traditional waterfall methodology, we would plan every stop, every day of driving and perhaps every meal break in advance before we even leave Boston. Using an agile approach, we decide on our ultimate destination, Seattle, but then make a day by day decision on how far to travel when to stop and where to sleep.
This step is all about specifying that ultimate destination and making sure we are clear on that we will recognise that when have arrived there.
Step 2: Build team
In many organisations, the business intelligence team is almost a “bodyshop”. Tasks arrive in their work queue; the BI team make sure that the requirements are clearly defined, then they prioritise the task list and complete the requested tasks as quickly as possible (or not, if it’s not a priority).
There are some serious problems with this approach. Firstly it relies on the “customer” actually knowing what they want and how to get it. It also creates delay when there the business owner needs multiple iterations, as they discover new and unexpected relationships or insights. To put it another way, it’s a can be like playing a game of chess by post.
The solution is to take a dev-ops style approach. If you’re not familiar with this jargon, it simply means building a cross-functional team, where the team has all the required skills to properly fathom the business objectives and deliver what is needed, rapidly.
It may not be possible to dedicate BI resource to a team for smaller, more transactional, BI tasks, where there the are more significant business objectives, the speed and productivity gains of having that dedicated resource can page considerable dividends in terms of productivity and responsiveness.
Step 3: Identify tooling & data sources
Different analysis jobs for me different types of tools. While there is a bewildering selection of powerful and interesting analytical tools on the market, experience shows that the fastest and best tool is usually the one you already have in the organisation. Most organisations have carefully erected defences against bringing new applications on site. Even if you are successful in bringing a new software tool in-house, you may well find that you don’t have the skills or experience within your team to make immediate good use of them. I have to say it’s embarrassing how many times I’ve ended up using Excel and PowerPivot to get a piece of analysis ‘over the line’, when it would have been a lot slicker and more fun to use Tableau or Qlik. That said it was often a choice between using Excel or not achieving any kind of output in the timeframe required.
Of course, your choice of tooling will also affect your choice of team members, so this step and the previous step can be iterative.
Another consideration, particularly in organisations with legacy hardware and platforms (that’s pretty much every organisation I’ve ever worked with) is where the data lives, how we can extract it and the form of the data. Again these facts strongly influence your choice of team members.
Step 4: Scrum
Backlogs and Sprints
The ‘things we want to do’ are called the ‘Analytics backlog’ - it’s a list of things that we would like to explore analytically. The term ‘backlog’ is a bit of Agile jargon and can be a bit confusing - think of it as a “to do list” for the whole FAAB project.
Going back to our road trip analogy, a sprint is like planning and executing the next day of travel on our journey.
Sprints usually last between one and three weeks.
Sprint Plan
At the start of each Sprint, the FAAB team needs to get together for the Sprint Planning Meeting with the ‘Business Owner’ to agree which items from the Analytics Backlog they want to tackle in the upcoming Sprint. These priority tasks then form the Sprint Backlog - again think of this as a ‘todo list’, but one that we intend to complete in the upcoming Sprint.
Daily Scrum
During a Sprint, we have daily ‘Scrum’ meetings. These daily sessions are facilitated by the ‘Scrum Master’ - that’s Agile-speak for the ‘Agile facilitator’. Their job is to remove roadblocks and to give cover to the team, so they can get on and work their analytical magic.
Sprint Review
At the end of each Sprint, the team gets together with the ‘Business owner’ to review the outputs of the Sprint. This playback should be informal, which means PowerPoint slides are not allowed, and the meeting must not become a task in itself.
Sprint Retrospective
At the end of each Sprint the whole team (including the ScrumMaster and business owner) spend some time reviewing how well The FAAB process itself worked during the last Sprint and what changes they may wish to it for the next one.
This cycle of Sprints progressively diminishing the Analytics Backlog continues until the team agrees with the business owner that we have cleared all of the Analytics Backlog to everyone’s satisfaction. Or, to put it another way, we have ‘arrived at our destination’.
Step 5: Acceptance
Although Agile does not have elaborate tollgate ceremonies that we see with traditional waterfall method, it’s still worth having a final check-in with the customer to make sure that all their needs and requirements have been met. If the sprints and scrum methodology have been running correctly, none of the final acceptance review should come as a surprise to the customer. It is also a great chance to make sure the business customer is delighted and to reinforce what a great job the team have done.
Step 6: Final QA
If we have done her job properly during the sprints, then there should be a bit of a formality. However, it doesn’t do client confidence or your career safety any harm just to do some final sanity checks and quality sampling on the data you have produced. If you want a tale to motivate you check out this horror story.
Step 7: Deliver
There often needs to be some kind of formal wrap-up, handover or transmission of information to bring a piece of analytical work to a close. It may be a simple report, launching an online dashboard or some kind of presentation. Whatever you need to do it makes sense to follow a process and a series of checklist to make sure you give full justice to the work that you’ve done appear professional and communicate things clearly and effectively.
Three tips for getting started with FAAB
- Don't try and do everything with FAAB, just focus on the big important projects.
- Accept that you may not always be able to mobilise a fully dedicated cross functional team. Although it's not ideal it's better to go with a part-time team than no team at all.
- Be prepared to adapt tweak and change the process to meet your needs. Just be wary of slipping back into waterfall style management all of having sprints that are too long.


![Complete Guide to the OKR Framework: How to Create OKRs for Your Team [2024] okr kpis and targets logo](https://madetomeasurekpis.com/wp-content/uploads/2021/12/okr-kpis-and-targets-logo@2x-150x150.png)