


Creating User-Friendly KPI Dashboards + 3 Free Excel Templates
What is a KPI dashboard?
Let's start with the basics: what is a KPI dashboard? A KPI dashboard is like the dashboard in your car - it gives you key bits of information you need to see at a glance. But instead of speed, gas level, and engine temperature, a business KPI dashboard shows you the most important metrics about your company's performance.
So without having to dig into complex data or reports, you can view graphs and charts that update automatically to show how your business is doing on things like revenue and costs, user signups, production targets, or whatever's critical for you to track. It lets you spot dips, trends, and opportunities right away so you can steer things in the right direction or address issues early.
If you need a quick primer on what key performance indicators (KPIs) are, check out our blog post, What is a KPI?
Purpose of a KPI dashboard
The purpose of a KPI dashboard is to give decision-makers an at-a-glance view of the key bits of data you and other leaders have picked as crucial for good business decisions. Rather than information overload, it puts the most vital metrics on one screen so you can see what's working and what needs more attention. Handy for staying on top of priority objectives!
A well-designed KPI dashboard should display the top measures in an easy-to-digest format, so you can:
- Keep tabs on what matters most by focusing on the key metrics critical for your business.
- Make informed choices based on real-time data, not outdated reports.
- See how your business is getting on over time and spot areas for improvement.
- Ensure everyone is working towards shared goals and targets.
In short, a KPI dashboard is a helpful tool for managers and decision makers to stay informed about the organisation's health and make data-driven decisions using an 'at a glance' summary.

Creating user-friendly dashboards
Building dashboards is something many of us have to do on a regular basis but creating user-friendly dashboards sometimes seems like an elusive subject resulting in the exercise often being done by gut-feel. The reality is that effective dashboard KPI design requires more than pure intuition.
Are you are fed up with debates about when to use colour, which colours to use, and how much data to put on a graph? The good news is there are research-backed dashboard design rules that provide really clear guidance on the necessary steps to create unambiguous, readable dashboards. We explore some of these rules deeper in our Effective Dashboard Design Principles section of this guide, but first let's chat about software.
Why use Excel to build your KPI dashboard?
Although many professionals roll their eyes and groan when Excel dashboards are mentioned, Excel is a great tool for building a KPI dashboard because it is user-friendly, flexible, and widely available.
Yes, there are limitations in terms of robustness and scalability compared with database and BI tools (e.g. PowerBI), but it can make a fantastic initial solution for simple applications - particularly if you can leverage a KPI dashboard template - and a great prototyping tool for more dashboard implementation using more powerful, robust and expensive tools further down the line.
Why you should avoid using Excel macros and Visual Basic (VB) in your KPI dashboards
Although the power of Excel can be extended using macros and Visual Basic (VB), there are several good reasons why you might want to avoid using either in your spreadsheets:
- Security risks: VB and macros can potentially be exploited by hackers, who can use them to gain access to sensitive data or execute malicious code.
- Compatibility issues: They may not be compatible with newer versions of Excel, or with other software that is used to view or edit the spreadsheet.
- Complexity: They can be difficult to understand and maintain, especially for people who are not familiar with programming. This can make it difficult for others to modify or update the spreadsheet, or to understand how it works.
- Performance issues: Spreadsheets that use VB or macros may be slower to open or calculate, especially if they contain a large amount of data or complex formulas.
- Maintainability: They tend to be written by 'enthusiasts' and often have little to no documentation, unconventional structure and complexity. When the original creator of the spreadsheets moves on, it can be a nightmare to maintain and fix them.
So, avoid using VB and macros in Excel spreadsheets if you possibly can. Instead, consider using built-in Excel functions or other tools that are less complex and less risky. You can go a very long way using the 'vanilla' functionality of Excel and this is likely to save you huge amounts of pain later on.

How to turbocharge your next KPI dashboard: Excel template free downloads
To demonstrate the power of his dashboard and reporting design principles, Bernie is sharing three awesome KPI dashboard Excel templates as a solid foundation for building your own. They're free to download so be sure to keep scrolling and grab them below.
In addition, we provide some articles on this website explaining the principle of using science to improve readability and if you want to go into a lot more depth, you can download our founder and dashboard guru, Bernie Smith's e-book on the subject - The Brilliant Excel Dashboards Manual - or you can check out our Brilliant Excel Dashboard short course below which includes the manual and much more.
Dashboard design online course
In our Brilliant Excel Dashboard Design online course, you'll learn how to rapidly create simple, clear and easy-to-understand dashboards using just Excel (no plugins, Visual Basic, macros or subscriptions).
In this three-hour course, Bernie covers the simple rules of clear, understandable report design, introduces you to the powerful 'Brilliant Excel Dashboards Kit' and shows you a complete dashboard design and build, using the full included kit.
With a little practice, you will find that you can create robust, good-looking and easy to maintain dashboards five times faster than starting with a blank sheet.
This course includes...
- Three hours of self-paced expert tuition
- The full Brilliant Excel Dashboards Manual PDF download
- The Brilliant Excel Dashboards Template pack
- The Brilliant Excel Dashboards Sample dashboards pack
This highly practical course is for anyone who...
- Wants to understand the principles of good dashboard design
- Needs to apply solid design principles to rapidly build impressive Excel dashboards
- Wants low maintenance dashboards, free of Visual Basic and macros, plugins and third party software solutions.
- Needs to build Excel dashboards fast
- Wants to look like a reporting rock-star
This course is on-demand, so you can get started as soon as you enroll.

Free to Download: KPI Dashboard Template Examples
These KPI dashboard examples are fully functioning and each download is a carefully designed, code-free Excel KPI dashboard template.
You are free to download them and use them to your heart's content - examine, tweak and extend the sheets in the same way you would any other sheet - with the only limitation on their use being that they are not licensed for resale. Simply register below for access.
If you are in a hurry and would like access to a complete library of tools to accelerate your work, then we highly recommend you check out the Brilliant Excel Dashboard Kit. There's a huge library of ready to use Excel sheets, support materials and templates, with no license fee or complexity.
")
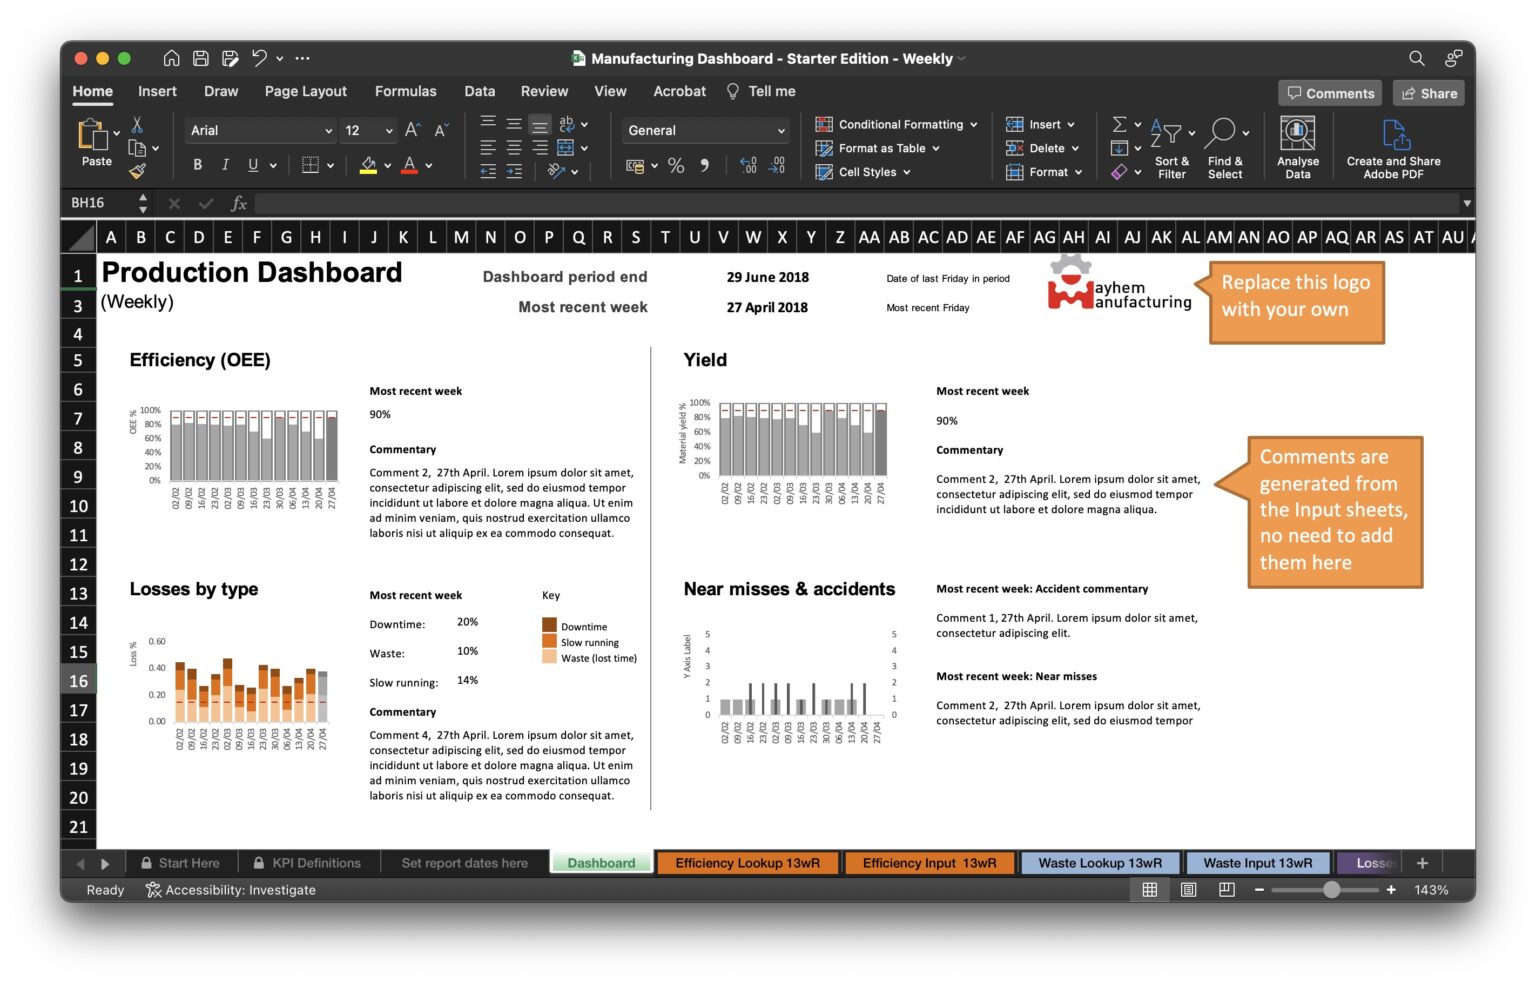
Free Excel Template KPI Dashboard for Manufacturing
The manufacturing KPI template metric selection for this starter pack covers five key indicators for a production environment. Identifying losses, using OEE and Yield KPIs are the vital ingredient for any process improvement programme...
-
- Overall Equipment Effectiveness (OEE)
- Efficiency losses by issue
- Material Yield
- Safety - accidents
- Safety - near misses
For more production KPIs check out these manufacturing KPI definitions.


Free Excel Template KPI Dashboard for Call Centre
This simple call centre KPI template covers four customer service KPIs...
-
- Total calls handled
- Average speed to answer
- First touch resolution rate
- Feedback scores (customer satisfaction)
For more call centre and customer service KPIs, check out these customer service KPI definitions. Further free resources, more focused on social media marketing and the online business side of things, but also covering customer satisfaction, customer lifetime value and several other KPIs can be found here.

Free Excel Template KPI Dashboard for Sales
This simple sales KPI dashboard covers four essential starter KPIs.
-
- Total value of sales
- Marketing return on investment (ROI)
- Order value per customer
- Lead conversion rate
Once you have implemented these four valuable measures, the module approach used in this free template will allow you to expand and extend the dashboard.
How to Use Your Free Excel KPI Dashboard Template
Time Needed: 1 hour
What you will need
Using your template
Step 1 - Download and rename your template
Once you have registered for your chosen template, a download link will be emailed to you.
Make a copy of that template and give it a meaningful file name.
Step 2 - Enter your data
Each KPI has it's own data entry tab (identified with 'Name of KPI Input'). The data does not have to be entered in date order.
The spreadsheet will automatically sort the data and set the date range. However, you can only have one row of data per time interval (week, in the sample sheets).
Step 3 - Set your report date
Head to the tab labelled 'Set report dates here'
- Dashboard period end - This date is used for set-period charts, such as financial year-end
- Most recent week - This the date of the last Friday in the time period you would like to report on
Step 4 - View or print your report
Head to the tab labelled 'Dashboard'
The whole sheet should be populated automatically based on the reporting date and data you have entered. The only reason you should ever need to alter this page is to re-design the layout, not update the content.
Step 5 - Cut, paste and improve!
It's unlikely these KPI dashboard examples will exactly meet your needs in their current state. They are intended to provide the basic building blocks for a real-world dashboard. Feel free to cut and paste these dashboards to meet your needs.
Don't forget to check out our 10 Essential Tips on How to Build a Brilliant Dashboard. If you come up with something special, that you are proud of and would like to share, please feel free to email it in.
Effective dashboard design principles
There are four simple principles listed below that underpin the design approach used in each free KPI dashboard template.
If you follow these principles when designing your KPI dashboard to present your business data, you will be off to a great start!
-
- If the reader does not understand the dashboard, chart or table, it’s probably the designer’s fault.
- Do not tax the reader’s memory. Make as much of your data as visual as possible, but accept that some people must see some numbers as well.
- Do not confuse your end-user. Keep the tables and charts as sparse and simple as humanly possible.
- If your end-user needs to use instructions to understand the document then your document has failed in its purpose.
These KPI dashboard design principles are based on the work of people like Stephen Few and Edward Tufte. Much of their insight comes from the role of memory in cognition. Here are a few key points on memory...

Memory and report design
The challenge with KPI dashboards is that we are trying to convey an insanely large amount of information in a very small space. For instance, a KPI dashboard Bernie built for a client a couple of years ago had nearly 2,000 pieces of information on an A3 sheet - and yet, it was quick and easy to understand!
To be able to transmit this amount of information without completely overwhelming the reader, we need to use some techniques based on an understanding of the way that humans process information.
Too much information for our primitive brains
The challenge is that our brains are designed for hunting, gathering and not getting eaten. We are now trying to use those brains to assimilate the kind of information we weren't really designed for. However, some of those legacy attributes can really help with KPI dashboard design (and our KPI dashboard templates have been designed with these principles in mind).
We see with our brain
The key thing to remember is that we see with our brains, not just our eyes. Yes, the eye transmits a signal but it's the brain that makes sense of it.
For the data to be processed, we need to not just see it; our brain needs to focus on it and subject it to conscious thought.
It is only when we pay attention to the information that it stands any chance of being processed or stored. It's a bit of a safety mechanism that makes sure our brains are not overwhelmed.
Memory is crucial
Memory plays a key part in understanding. And I'm not just talking about the type of memory that enables you to know Great Aunt Mabel's phone number without looking on your phone.
There are at least 3 types of memory and it's probably worth recapping what these are and why they are important:
-
- Long-term memory
- Short-term memory
- Very short-term memory or “Iconic memory”

1. Long-term memory
This is the type of memory that enables you to remember names, what your phone number is or that nasty scrape to your knee when you were six. This is the type of memory that most people think of when you talk about "recall".
It can be very useful but your brain jealously guards this capacity. Something normally needs to be either very dramatic or repeated frequently to be filed away in this valuable part of your brain.
Why long-term memory is important for reports
For KPI dashboard and report design purposes, this type of memory is really important when it comes to layout.
Make it intuitive and fast!
If you frequently visit the same website or read the same newspaper, you will just "know" where things are on the page. You do not have to hunt around to find what you're looking for. It's just the same when you get in your car and you know where the indicator stalk is (try getting in a car with the stalk on a different side from the one you're used to and you'll know what I mean!).
So for good, effective performance tracking using dashboards, we need to respect and treasure the reader's long-term memory. Consistency in layout and familiarity of key positional details in KPI dashboards is absolutely crucial to making reports readable and accessible. Interestingly, until the dashboard becomes familiar and easy for them, this consistency will not be apparent to the user.

2. Short-term memory
Short-term memory is the kind of memory that enables you to remember what drinks you're ordering at a bar, which hotel room you're in or recall what was in the news. It's a kind of short-term holding area. It is sometimes called "active memory". It can be very useful for comparing a few figures or "chunks of information".
Unfortunately, research shows that we can only remember between five and nine chunks of information simultaneously.
We typically hold things in short-term memory for 20-30 seconds, although we can extend this through reactivation of the memory. This reactivation is called "covert rehearsal".
Reactivation prevents neural endocytosis, keeping the memory alive for longer than the 20-30 seconds that is typical of short-term memory (clearly essential for remembering which hotel room you are in!).
Most people’s short-term memory is terrible!
Now this is important and relevant to our dashboard and report design process. Even the simplest of business charts will normally have a dozen or so data points (typically monthly data for the last year), so if it's true that we can only remember five to nine points or chunks of data then it means that your average person is incapable of holding enough information in their short-term memory to analyse a simple annual chart!
Why the term "chunk" can help us
The good news is that the term "chunk" is quite elastic. A chunk can be a number but it can also be a shape or line. Now, this is good news because obviously a chart line can give a lot more insight than a single number.
So, one of the key principles (tricks) with dashboard design is to lump as much information into a chunk as we can in a meaningful way.
This means "no" to endless data tables and "yes" to simple, streamlined, stripped-down charts.

3. Very short-term memory "Iconic Memory"
Now iconic memory may not even sound like memory to you. It's probably easier to show you an example rather than describing it with lots of words. Once you see iconic memory in action, it will change your understanding of how dashboards work forever...

Visual Encoding
The technique you have just seen is the application of "visual encoding". Visual encoding is the tool by which you encode specific information in a visual way. Humans are designed to react to visual information extremely quickly.
The good news for our KPI dashboard design is that there are a number of visual encoding methods we can use.
If we choose carefully we can use several of them at the same time. Let's have a look at some of the techniques by category. The following categories are based on those devised by Colin Ware in his book "Information Visualization: Perception for Design.
There are a number of different ways of conveying information in a way that uses iconic memory. The example above shows just a few of them; if you want the full list see Stephen Few's excellent book "Information Dashboard Design" referred to earlier.
KPI Dashboard FAQs
'Practical KPI Dashboard Design Using Excel' Webinar

In the 40 minute session we will cover...
- The single most important thing you must never do when designing a dashboard
- A simple set of rules to help keep your dashboards clear and easy to understand
- Three practical killer-tips for Excel dashboard design
The session will include some useful free downloads and some very special offers.


")

Need for Safety reporting KPI
Need free templates