


How Many KPIs Should I Have? A Guide on How to Choose the Right Metrics
Having too high a number of KPIs isn't just annoying – it's dangerous for your business. When organisations track an overload of metrics, they often face:
- Decision paralysis
- Wasted time and resources
- Confused and overwhelmed teams
- Diluted focus on what truly matters
This leads to the common question: "How many KPIs should I have?" But how do you decide which ones to keep and which to discard? Learning how to select metrics is a balance between too few, which risks missing critical insights, and too many, which leads to confusion.
Think of key performance indicators like spices in cooking – use too many, and you'll ruin the dish. The key is knowing how to choose KPIs that give you the right flavour of information without overwhelming the taste.

Why KPI Overload is Dangerous
Selecting the right KPIs is like walking a tightrope. Too many KPIs, and you’ll face overload, confusion, and frustration. Too few, and you risk missing key measurable information needed to protect your business, your team, or your bottom line.
So, how many KPIs should I have to avoid KPI overload while staying confident you're measuring the right things, covering the essentials, and not drowning in admin?
The answer is called Shortlisting. It’s a technique from Step 4 of the ROKS method—our structured, proven approach to developing KPIs quickly, safely, and effectively.
How to Choose KPIs: A Structured Way
Picking the right metrics and trimming down too many KPIs is a bit like decluttering your home. You need a clear system to decide what stays and what goes. That’s where our Shortlisting method comes in—it's a proven way to teach you how to choose KPIs that are both critical to your business and practical to track so that you can make confident decisions.
When you create your KPI Trees (Step 3 of the ROKS method), you’ll end up with a long list of potential measures. Some teams are shocked to see they’ve come up with 70, 80, or even more. But here’s the good news: you won’t need all of them.
Why Some Measures Don’t Make the Cut
You’ll leave some measures out for reasons like:
- They’re not important enough to justify tracking.
- They’re too hard to measure or report on.
- They need more time or resources to measure than you currently have.
How to Trim Too Many KPIs
Your job now is to narrow it down. Start by having the group rate each potential measure on two criteria: Importance and Availability. Then, plot these ratings on a simple four-box grid or matrix.
Understanding Importance and Availability
Importance: How significant is this measure to your business?
- This isn’t usually a yes/no decision. Instead, you can score it on a scale of 0-10.
- If there’s disagreement, break it down further into criticality and breadth of influence. (Though in practice, this level of detail is rarely needed.)
- A score of 10 means it’s absolutely essential.
Availability: How easy is it to get hold of the data?
- A score of 10 means the data is fully automated, reliable, and effortless to work with.
- A score of 0 means the data is almost impossible to gather—either requiring extreme effort or not being collectable at all.
This structured process helps you focus on the measures that truly matter and are practical to track.
KPI Shortlisting Checklist: How Many KPIs Should I Have
Here’s a step-by-step guide to streamline your performance indicator shortlisting process:
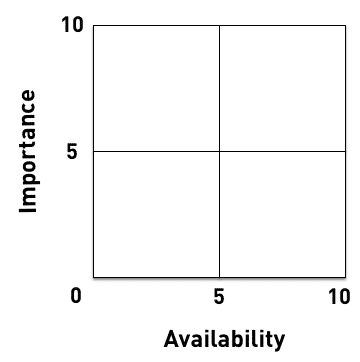
Setting Up the Matrix
- Grab a flip chart.
- Label Importance on the vertical axis and Availability on the horizontal axis.
- Draw dividing lines at the midpoint of each axis to create a four-box grid (a matrix).
- Number the bottom-level measures on your KPI Tree for easy reference.
- As a group, rate each bottom-level KPI Tree measure on a scale of 0-10 for:
- Importance: How significant it is to your business.
- Availability: How easy it is to get the data.
- Note down any disagreements about scores as you go. This creates an audit trail for if the final measures chosen are challenged later on.
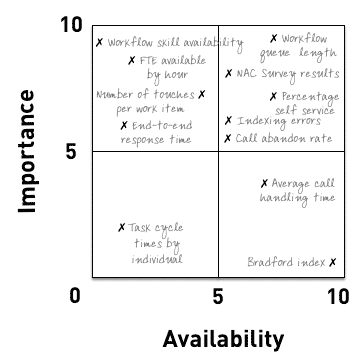
- Plot each measure on the chart using a cross and its name (or reference number).
You should end up with something that looks like this:
Using Post-its
Write each measure on a Post-it note. This makes it easy to move them around on the matrix during discussions. If there’s debate over ratings, you can separate or adjust them quickly.
Tip: Before taking down the flip chart, snap a picture to avoid losing your work if the Post-its fall off!
Using the Matrix to Prioritise KPIs
By plotting your measures on the matrix, you’ll have a clear answer to the question "how many KPIs should I have" by using the four quadrants to decide what to focus on:
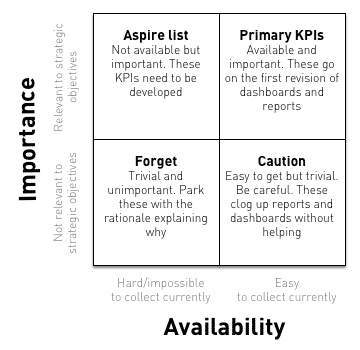
Top Right: High Importance, Easy Availability
- These are your “do it now” measures.
- High impact and easy to collect—perfect for your first dashboard or report.
Top Left: High Importance, Hard Availability
- These are your Aspire measures—your performance indicator development to-do list.
- Focus your development efforts here to improve data collection and KPIs over time.
Bottom Right: Low Importance, Easy Availability
- These are trivial but easy to collect measures.
- Double-check any measures close to the important boundary, but don’t include measures just because they’re easy to collect.
Bottom Left: Low Importance, Hard Availability
- These are trivial and hard to collect measures.
- These are discard measures—not worth your time unless they’re near the top right box.
Dividing Your Measures
By the end of this exercise, you’ll have three lists:
- Use List: Measures ready to implement now.
- Aspire List: Measures to develop over time.
- Discard List: Rejected measures with documented reasons.
Why the Discard List Matters
Don’t skip this step! Recording why measures were rejected can prevent future report bloat and show the rigour of your process. For example: "We didn’t include this measure because it’s too hard to collect and has limited impact.”
Developing Your Aspire List
The Aspire list often contains measures that are tricky to collect or aren’t yet part of your data systems. Treat each measure here as a mini-project. This keeps the development structured and avoids accidental overcommitment or surprises.
By following this process, you’ll create a balanced, focused set of KPIs that your team can implement confidently.
Developing Your Missing Measures and KPIs
Follow these steps to develop new measures and KPIs effectively:
- Confirm the Need: Make sure the measure is worth tracking before committing resources.
- Identify Stakeholders: Use a RACI matrix to identify who’s Responsible, Accountable, Consulted, and Informed.
- Define the Measure Part 1: Use the KPI definition checklist to clearly define the measure.
- Define the Measure Part 2: Review the definition with key stakeholders to ensure alignment.
- Check Feasibility Part 1: Do a quick feasibility study, especially if IT systems are involved.
- Check Feasibility Part 2: Confirm what organisational project management methods or systems you need to align with.
- Assign a Project Manager: Appoint someone to manage the project, either full-time or part-time.
- Create a Project Charter: Write a one-page charter outlining:
- Objectives
- Resources needed
- Timescales
- Anticipated issues and how to mitigate them
- Draft a Project Plan: Keep it simple and focused.
- Review the Project Cost and Timescale: Double-check if the measure is still worth pursuing.
- Create and Maintain an Action Log: Track all actions with clear details, due dates, and ownership.
- Set Up Simple Project Governance: Establish basic governance rules, like meeting schedules and tracking progress, to keep the project on track.
In some cases, this may be more substantial than a 'small' project but the principles remain the same and there's plenty of guidance out there for running projects.
Tip: Use Action Logs to Stay on Track
Action logs are essential for keeping things organised. They're simple but extremely useful tools. You can create your own or download my free template, but make sure to include:
- A unique reference number for each action.
- A grouping description (e.g. "IT" or "Training") for clarity.
- A clear description of the action.
- The owner of the action.
- Due date for completion.
- Status (e.g. open, closed, on hold).
- Notes or comments for context.
- Optional fields for risks and mitigations.
Recap: How to Shortlist Too Many KPIs
When you’ve got too many indicators and heated debates about what you should or should not implement, this method offers a structured way to find a solution. By following these steps, you’ll master how to choose KPIs that drive results while avoiding unnecessary complexity.
Time Required: ~2 hours
Estimated Cost: ~$100
What You’ll Need:
- A list of KPIs or measures you’re considering
- A meeting room or video call setup
- A spreadsheet (Excel, Google Sheets, etc.)
- 4–8 team members who understand the areas you want to measure
Tools Required:
- A computer
- A spreadsheet program
Seven Steps to Shortlist Your KPIs
- Add the KPI name to your spreadsheet.
- Score its importance on a scale of 1–10 (10 = essential for survival).
- Example: "Cash in bank" might score a 10.
- Record the reasoning for each score in a "Comments" column.
- Agree on a score (1–10) for how easy it is to measure.
- Example: A 10 would be a fully automated measure with no human effort.
- Add reasoning in the "Comments" column.
- Work through each KPI on the list, scoring for both Importance and Ease of Measurement.
- Add a column to multiply each KPI's Importance and Ease of Measurement scores.
- The result will be a ranking score between 1–100.
- Use the ranking score to sort your KPIs in descending order.
- Add a "Status" column and label each KPI:
- Primary: High ranking; measure and report this now.
- Aspire: High Importance but low Ease of Measurement; work on these later.
- Discard: Low Importance and/or very hard to measure; drop these.
- Fully define the KPIs marked as Primary and start using them.
- Revisit the Aspire list periodically as you progress with your Primary KPIs.
Making Measurement Work for You
Choosing the right KPIs and trimming down too many KPIs doesn’t have to be overwhelming. With this simple shortlisting process, you can turn a long, daunting list into a manageable plan.
Focus first on the KPIs that matter most and are easiest to measure. Keep track of what you’re leaving out and why—it’s just as important to know what not to measure.
With this process, you’ll confidently answer "how many KPIs should I have" by cutting through the noise, aligning your team, and creating a dashboard that drives results. Start with your Primary KPIs, keep an eye on your Aspire list, and discard what doesn’t add value.
By following these steps, you’ll not only have a lean and focused set of KPIs but also a clear, defensible process for how you got there. And that’s how you make measurement work for you.
Where to Next
We have loads of tools and resources to help you through every stage of your performance measurement journey. Take a look at these posts you might need along the way (and bookmark the ones you want to come back to!):

")


