A Guide to the Best KPI Tree Software Tools
In today's data-driven world, making savvy decisions is vital — not just helpful. Key Performance Indicator (KPI) Trees have emerged as a crucial resource to quickly turn strategy into measurable objectives and to visualise complex relationships, conflicts and interdependencies within an establishment. But with loads of program options available, how do you pick the right one to unlock the full potential of this framework?
In this guide, we delve into the key criteria for selecting the most effective KPI Tree software tools that can take your executive planning to new heights. And to show our commitment to your success, we're offering a complimentary KPI Tree PowerPoint (PPT) template at the end of this article to help you start visualising your own figures straight away.
If you're completely new to this framework and want a full definition, head to our Ultimate KPI Tree Guide for everything you need to know including a breakdown of the purpose of a KPI Tree.

Metrics Visualisation Benefits
The practice of visualising metrics has ample benefits:
- Understanding Complex Data - Transforming abstract numbers into intuitive maps and graphs to spot patterns, relationships and outliers more easily.
- Improving Decision-Making - Presenting data visually makes it easier to identify key insights to inform critical decisions, cutting down on traditional report analysis.
- Enhancing Communication - Sharing and explaining intricate data points, relationships or conflicts in an engaging, accessible way for diverse audiences.
- Strategic Planning - Mapping relationships between KPIs and objectives to take a more high-level approach to setting and managing goals.
- Performance Tracking - Enabling real-time tracking of changes so strategies can be adjusted swiftly based on the latest data.
- Educational Purposes - Exploring optimal practices and techniques to implement impactful data via yourself or across your organisation.
Among various metrics visualisation techniques, the KPI Tree methodology stands out. They have a unique ability to provide vital visibility between high-level business goals and ground-level performance analysis by structuring objectively measurable markers across multiple layers. The benefits of using KPI Trees help you choose meaningful and productive KPIs, and facilitate a deeper understanding of each performance measure, enhancing decision-making and long-term planning. For a comprehensive exploration of these advantages, our detailed Ultimate KPI Tree Guide delves into how they serve as a cornerstone for data-driven success.
Digital KPI Tree Drawing Tools
One of the powerful features of these performance measurement maps is that they make it quick and simple to understand complex business relationships, visually. There is a clear visual standard, developed by Bernie Smith when he created the KPI Tree methodology, and a common question is 'What programs and templates can a KPI creator use for building these maps?'
Whichever digital KPI Tree drawing tools you opt for, certain features will make sketching out the graphs much simpler and swifter. These enable you to swiftly structure and rearrange Tree elements as your thinking evolves. Top notch formatting capabilities help you style and polish the aesthetics perfectly too.
You'll also want handy collaboration functionalities allowing stakeholders to co-create Trees seamlessly. User-friendly templates can provide a ready graphical framework to adapt rather than starting from a blank page. The capability to easily export and share finalised Trees for universal accessibility is essential too.
Ultimately, the KPI Tree tool is there to serve the core goal - crystallising organisational objectives and performance metrics in an intuitive visual form that unites teams behind strategy.
What to Look for in a KPI Tree Tool
When evaluating KPI Tree software, prioritise solutions with specific essential illustration capabilities while considering added features that can streamline working with sophisticated representations.
Essential KPI Tree Software Capabilities:
- Vector-Based Graphics: Enables flexible resizing of Tree elements without losing caliber. Crucial for creating clear, professional KPI Tree diagrams.
- Object Handles & Connectors: Allows swift restructuring of Tree components through click-and-drag handles and dynamic linking lines. Streamlines iterative development of Trees as thinking evolves.
Very Helpful Supplementary Features:
- Layer Support: Lets you organise distinct aspects of complex Trees on separate layers for easier editing.
- Artboards: Enables exporting sections of an intricate Tree into distinct files. Helpful for breaking down incredibly sophisticated trees.
- PDF Export: Allows universal sharing of completed KPI Tree diagrams with stakeholders who may lack access to the original illustrating platform. Broad compatibility.
Best KPI Tree Drawing Software
When searching for the best KPI Tree drawing software, you'll find a range between full-featured paid platforms and unpaid simplified illustration apps. The premium platforms offers enhanced capabilities for tackling intricate Trees, while the free KPI Tree creators provide a convenient starting point for basic diagrams.

1. Visio (Windows users) [Paid]
Visio is the grandaddy of vector diagramming program. It's powerful, steady and adaptable. If you need to build and handle a complex KPI Tree library in a Windows environment without cloud collaboration, it's the unmatched fit.
Pros
- Speedy and robust, even for massive schemas.
- Many businesses already have access via standard catalogues.
- Secure and private.
Cons
- Must have Visio to edit Trees.
- Fairly steep learning curve.
- No cloud collaboration - desktop app only.

2. OmniGraffle (MacOS users) [Paid]
OmniGraffle is a capable Visio alternative for Mac. It's just as robust and flexible. Perfect for complex chart creation on Mac devices without cloud sharing.
Pros
- Powerful and fast with sizable Trees.
- Layers enable guideline overlays for simpler organisation.
- Artboards allow exporting Tree sections selectively.
Cons
- Must have OmniGraffle to edit trees.
- Steep learning curve.
- Pricey for Pro version.
- No cloud collaboration.

3. PowerPoint (Simple Trees) [Free] + Complimentary Template
PowerPoint is widely used, easy to use and surprisingly versatile. It makes a handy basic solution for building and sharing straightforward Trees.
Pros
- Most folks already have it.
- Intuitive for existing users to edit achematics.
- Connector snapping enables automatic routing.
Cons
- Limited space for more complex Trees.
- Can't handle multiple connector handles effectively.
- No layers or artboards.
So PowerPoint is great to start out, but expect to outgrow it fast with intricate trees.
Our free KPI Tree template ppt is available for download to help you hit the ground running. These hierarchical slide templates are easily customisable. If you're looking for an Excel template, we provide a complimentary one with every KPI Checklists book purchased.
You can download our KPI Tree PPT PPTX file for free by registering here....

4. Miro (All Platforms) [Free]
Miro is an infinite online whiteboard built for collaboration. For cooperative Tree building workshops, it's hard to beat. As a robust, mature platform, Miro also offers handy extras like video chat, voting and presentation modes.
Pros
- Cloud-based for real-time teamwork
- Intuitive to use
- Speedy performance even with massive Trees
- Reasonable subscription pricing
- Support across cloud, desktop and mobile
Cons
- Some object shape limits hinder visual standards
- Past service disruptions
- No layer support
- Buggy connector behaviour
- Imports only allowed on paid plans
So Miro is stellar for online collaboration, but lacks a few schematic bells and whistles. For uncomplicated Trees though, it brings powerful flexibility plus the magic of instant virtual teamwork.
Elevate Your Business Strategy with our KPI Tree Starter Pack
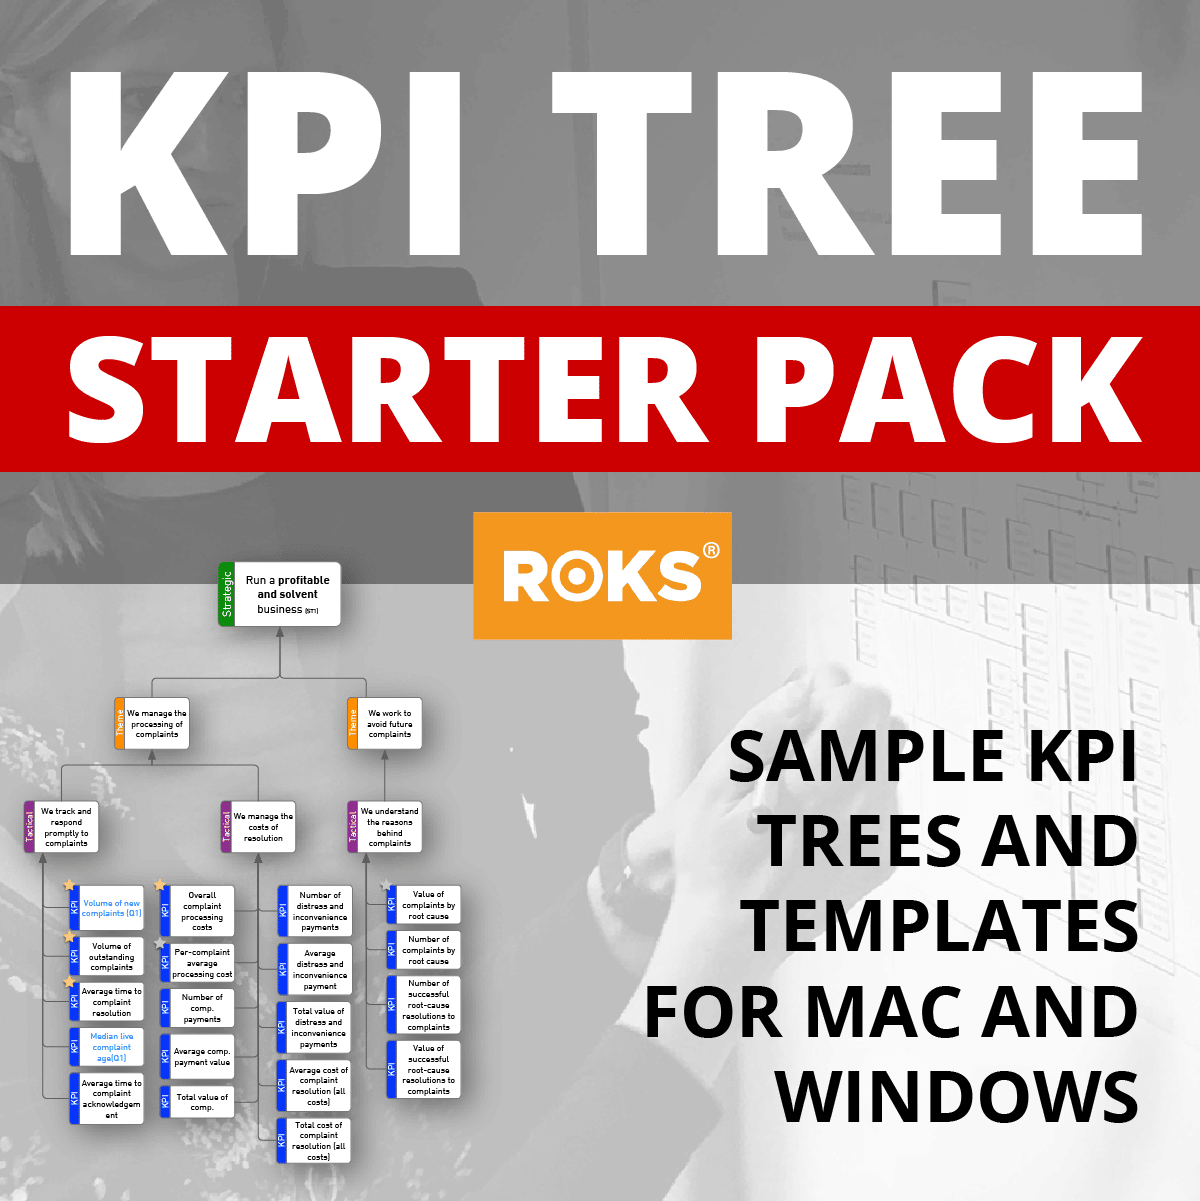
Unlock the full potential of your executive planning with our comprehensive KPI Tree Starter Pack. This product is designed specifically as an all-inclusive bundle that provides you with premium templates in Visio, OmniGraffle, PowerPoint, and Miro formats. Whether you're looking to streamline your metrics schematics process, align your team around shared goals, or simply get started in enhancing your performance measurement efforts, our KPI Tree Starter Pack is your essential toolkit.
What’s Inside?
- Visio Templates: Craft detailed and dynamic maps with ease.
- OmniGraffle Templates: Design visually stunning KPI frameworks.
- PowerPoint Templates: Communicate your vision clearly and effectively.
- Miro Templates: Collaborate on graphs in real-time with your team.
AND
Our comprehensive pack includes meticulously designed illustrations to cover crucial aspects of your business performance. Each template is grounded in the ROKS Express method, focusing on the 'Big 6' Strategic Objectives to provide you with actionable insights. Here’s what you’ll also find:
- Service Quality KPI Tree
- KPIs in Tree: 21
- Overview: A foundational illustration that visualises key indicators for assessing and enhancing service quality.
- Complaints and Incident Handling KPI Tree
- KPIs in Tree: 20
- Overview: Dedicated to improving the management of complaints and incidents, this illustration provides a structured approach to enhancing customer satisfaction.
- Finance KPI Tree
- KPIs in Tree: 35
- Overview: A comprehensive illustration that breaks down financial metrics to align with high-level financial management and planning.
Each chart is designed not only to guide you in monitoring and evaluating specific areas of performance but also to facilitate tactical discussions and decision-making processes. By leveraging these KPI Tree templates, you gain access to a structured methodology for aligning your business objectives with actionable metrics, ensuring a holistic approach to performance improvement.
Perfect for businesses of all sizes, these templates are designed to be intuitive and adaptable, ensuring you can start leveraging the power of KPI Trees right away.
Take the First Step Towards Unmatched Strategic Clarity—Today.
Don’t let complexity hinder your growth. If you're looking for inspiration and a head start on indicators for your specific business, have a look at the product offering at our dedicated KPI Store or visit the KPI Tree Starter Pack now, and begin your journey to streamlined success and unparalleled insight. Discover how our specially curated templates can transform your approach to performance measurement.
KPI Tree Drawing FAQs
Fault Tree vs KPI Tree: whilst they may look superficially similar, there are fundamental differences between these two. Not only are they intended for different purposes - a Fault Tree for problem-solving and a KPI Tree for selection of performance metrics - they use a different thought process, too.
Fault Tree analysis focuses on the many things that can cause a problem.
A KPI Tree is based on results, outcomes and objectives, or 'things that go right'.
This may sound like a small difference but it has a fundamental impact on the complexity of our chart. Let's take a simple real-world situation.
KPI Tree analysis:
- Our motorbike starts first time
Fault Tree analysis:
- We have no fuel flowing
- We have lost electrical power
- There is a mechanical obstruction to starting
- We have insufficient starting torque
- Our fuel is incorrect
...the list goes on, and on, and on.
Even at a relatively high level, the Fault Tree list is potentially endless. Positive outcome Trees generally have far fewer options.
Possibly, although it's hard to give a definitive answer. Given that they are fundamentally different methods, there are likely to be tensions and compromises when using an application designed for a different purpose.
For example, cross-linking, which is essential for our charts, is not natively supported in FTA solutions. Fault Tree Analysis notation is different, so FTA shapes are also unlikely to natively support KPI Tree designs.
Event Trees were developed as a leaner alternative to Fault Trees, but both differ fundamentally from KPI Trees in purpose and form. For more background on Event Trees, head to Wikipedia. Repurposing Event Tree programming for KPI Trees could create conflicts due to mismatching features.
Templates designed for event sequences allow for a superior starting point when searching "event tree vs KPI tree 2024" guides. Yet dedicated solutions like our KPI Tree Starter Pack with custom Visio templates and depictions are tailor-made to aid this distinct mapping technique. For those exploring Visio's capabilities for efficient KPI Tree building, our add-in provides robust functionality to save effort.
KPI Tree Templates
For a complete bundle of Visio, OmniGraffle, PowerPoint and Miro templates, check out the KPI Tree Starter Pack...


