What is the Balanced Scorecard (BSC) Approach?
The KPI Balanced Scorecard (BSC) isn’t as straightforward as it seems—especially if you’re using a first-generation model, which we strongly recommend against. Our guide breaks down the evolution of the Balanced Scorecard, showing why the third generation, called KPI Trees, is the real game-changer for modern strategy. Ready to see why?
What is a balanced scorecard?
The balanced scorecard approach is a visual framework to manage strategic performance. It helps organisations pick the right KPIs to track, so they can see and improve their overall performance. It doesn’t just focus on financials; it also looks at other key areas that matter for long-term success.
What is the history of the BSC?
The BSC was developed by American management consultants Dr. Robert Kaplan and Dr. David Norton. It first appeared in their 1992 Harvard Business Review article, The Balanced Scorecard - Measures that Drive Performance, and was later expanded in their 1996 book, The Balanced Scorecard: Translating Strategy into Action.
Before the BSC, performance management mostly relied on financial measures like revenue and profit. Kaplan and Norton argued that this focus didn’t suit modern, complex organisations. They designed the BSC to give a fuller picture by tracking performance across multiple areas—not just finance.
Today, the BSC is used worldwide as a key tool for performance management and strategic planning.
The three types of BSC
BSCs have evolved through three distinct stages. If you’re just interested in building one, feel free to skip this part. But if you want to understand them better, it’s good to know about the three different types commonly used. For each generation, we've included an image as a balanced scorecard example.
First Generation: The Four Perspectives

When Kaplan and Norton first introduced the BSC in 1992, they outlined four dimensions:
- Financial perspective: Focuses on financial performance—metrics like revenue growth, profit margin, return on investment, and shareholder value.
- Customer perspective: Looks at the organisation’s relationship with customers, using measures like customer satisfaction, retention rates, and net promoter scores.
- Internal business process perspective: Focuses on internal processes and operations, with measures like on-time delivery, quality control, and efficiency.
- Learning and growth perspective: Examines the organisation's ability to learn and grow, including measures like employee satisfaction, training and development, and innovation.
These four dimensions aimed to give a well-rounded view of performance, guiding organisations to choose a few key KPIs to support better decisions and improve performance. However, many legitimate criticisms of the BSC approach come from this first generation model. Here’s why:
Problems with first generation BSC
- Not adaptable for all sectors: These four perspectives didn’t fit well for public sector or non-profit organisations, or specialised departments within larger companies.
- Too much subjectivity: Jumping straight from broad perspectives to specific KPIs led to subjective metric choices. Teams often lacked confidence in the selected KPIs without a clear, rational basis.
- Limited KPI interaction: This model didn’t show how different KPIs affected each other, missing valuable connections between performance areas.
In short, the first generation model tried to standardise KPI creation with its set perspectives, but its framework was too limited to be of practical use. As a renowned KPI consultant and performance management expert, I strongly recommend not to use the first generation model.
Today, more advanced models, like the third generation scorecards described later in this guide, offer better solutions.
Second Generation: Strategy Maps

By the mid-90s, Kaplan and Norton evolved the balanced scorecard by coming up with a “Strategy Map.” This introduced long-term aims grouped within the four dimensions. Each aim would then have one or two KPIs linked to it.
Benefits of second generation BSC
This approach allowed each perspective to break down into clear, specific goals and outcomes before KPIs were chosen. These goals, connected by lines on the Strategy Map, gave much more context and credibility to the selected KPIs.
Problems with second generation BSC
- Restrictive for large organisations: Although this model clarified the link between KPIs and strategy, the three-level structure (Perspective - Strategic Outcome - KPI) could feel rigid and wasn’t practical for large, complex organisations.
- Perspectives lack meaning: The four perspectives acted more like categories than true outcomes, so they didn't hold much significance in themselves and wouldn't be comprehensive for many types of organisations.
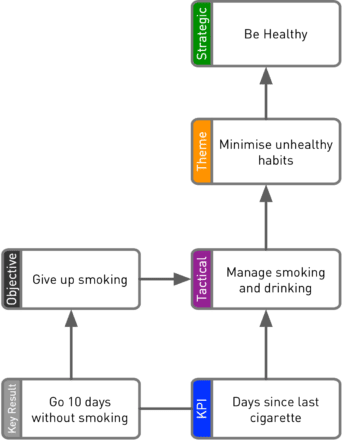
Third Generation: KPI Trees

The third generation of BSCs addresses the issue of “perspectives” being too abstract and not specific to an organisation’s actual goals. Instead of perspectives, this model uses strategic results, outcomes, or goals that align with the organisation’s strategy.
The KPI Tree approach brings flexibility by using three layers of strategic outcomes (plus KPIs) and mapping out both positive and negative relationships. KPI Trees also allow KPIs and OKRs to be aligned and displayed in a unified, clear, and visual way.
Benefits of third generation BSC
- Easier to read, explain, and understand.
- Can represent even the most complex organisations when designed well.
- Adaptable to any organisation’s unique priorities, structure, and nature.
- Capable of showing complex interdependencies within the organisation.
Problems with the third generation BSC
- Although easy to interpret and explain, they are more complex and demanding to create than earlier scorecard models.
- Starting with a “blank sheet” to define organisational outcomes can feel overwhelming.
Each generation of the KPI balanced scorecard builds on the last, ultimately making KPI Trees the most effective approach today. This article’s implementation advice focusses on third generation scorecards.
How does a KPI balanced scorecard model work?
The idea is pretty straightforward: to know how well we're doing, we need to measure and set targets for key parts of our performance. The most important measures—our KPIs—should connect directly to the outcomes we care about, like strategic outcomes, results, or goals. So, our scorecard should focus on the KPIs that are both strategically relevant and practical.
To do this, organisations first need to choose the specific KPIs that will help them reach their high-level goals and long-term outcomes. Using tools like KPI Trees and the ROKS frameworks offers a structured way to identify the best indicators for their strategy.
How To Implement The Balanced Scorecard Framework (With Examples)
Choosing the right KPI balanced scorecard approach for your team is essential to translate strategy into action. Here's how to implement the third generation scorecard.
Using the Balanced Scorecard to Choose Your Performance Measures
When you look for a balanced scorecard example, you will often see them presented with just outcomes, or results, on the diagram. As an illustration, "We deal well with customer calls" is an outcome...

...but "Post-call feedback score" is the KPI that tracks that outcome.
While outcomes and KPIs are closely related, each outcome may have several KPIs linked to it. You can’t put a number to “We handle customer calls well,” but you can measure “Post-call feedback score.”

Those using the KPI Tree framework as their third generation scorecard can easily develop their KPIs from the three. Here's an expansion of the example shown above, for a specialised financial services customer services function...
When using a KPI Tree (a third generation scorecard), it’s easy to develop KPIs from these connections. Here’s an expansion of this approach for a specialised financial services customer service function…
 version 1-1")
Choosing the Right Strategic Objectives
When picking strategic goals, it’s key to keep a few factors in mind:
- Mission and vision: Goals should align with the organisation’s mission and vision, supporting its long-term outcomes.
- External environment: Goals should reflect the organisation’s market landscape, including competitors, customers, and regulatory or economic factors.
- Stakeholder priorities: Consider the needs and priorities of different stakeholders.
- Resources and capabilities: Goals should be realistic and achievable within the organisation’s current resources and capacity.
It’s often advised to make strategic goals SMART (specific, measurable, attainable, relevant, and time-bound) so they’re clear and easy to track. Experience shows that even SMART goals frequently fail. Check out my Strategy Checklist to determine if your strategy is ready to support meaningful measures and instead of SMART goals, consider using the much more robust ROKET-DS framework for target design.
Tip: For a simple, practical three-step method for writing goal statements that truly work, check out How to Write Goal Statements.
Create Your Own Balanced Scorecard
Follow these six steps to build a balanced scorecard:
- Identify strategic objectives and measures: Choose the key goals and specific measures that reflect performance across four areas: financial, customer satisfaction, internal processes, and learning and growth. Tip: The ROKS Enterprise method offers a logical, structured approach to help with this.
- Set targets or benchmarks for each measure: Use your organisation’s strategic goals and past performance to establish realistic targets or benchmarks. Tip: Use our ROKET-DS framework to help you do this.
- Track and measure performance: Collect data from the various departments and consolidate it in one place to get a clear view of how you’re performing across measures. Tip: We can help you fix 7 common KPI report implementation issues and many other implementation problems.
- Identify improvement areas: Compare your performance against the set targets or benchmarks in review meetings to spot areas needing attention. This should be done in a structured way. Tip: Read our 3 essential questions for reviewing KPIs to understand how regularly this should be done and how to get the most out of the meetings.
- Develop and implement solutions: Address any areas of weakness or improvement identified in the previous step. The Lean Six Sigma methodology has a huge range of relevant tools for process improvements, including:
- Structured problem-solving
- Process mapping
- Cycle time reduction (SMED)
- Control charts for analysing variable processes
- Tip: Get equipped with a wide range of these tools through my KPI Black Belt programme.
- Continuously monitor and adjust: Use the scorecard to regularly check your progress and make any necessary adjustments to stay on track.
How to Use a Balanced Scorecard
A KPI balanced scorecard helps you choose KPIs and set targets or benchmarks for them. Once the KPIs are set, you need to start tracking performance. This allows you to compare results against targets, highlighting areas where improvements are possible.
When improvement opportunities arise, develop strategies to tackle them. This might mean revisiting processes, adding new technology, or providing team training. Continuous improvement is key - it's crucial to keep monitoring and adjusting as you go to ensure progress stays on course. The infographic below outlines the improvement cycle.
To really understand how to use a balanced scorecard well, you need to be aware of both the benefits and the drawbacks of this tool.

Balanced Scorecard Example for a Manufacturing Business

Here are illustrative key performance indicators for a fictitious small manufacturing business, Mayhem Manufacturing:
Balanced scorecard measures:
1. We are profitable and solvent (strategic outcome)
- Revenue growth
- Profit margin
- Return on investment
- Shareholder value
2. Customers love our products (strategic outcome)
- Customer satisfaction scores
- Customer retention rates
- Net promoter scores
3. We have the leanest operation in our section (strategic outcome)
- OEE (Overall Equipment Efficiency)
- Yield
- On-time-in-full delivery rate (OTIF)
- Gross margin
- Warranty claim rate
4. Our team love working with us and are highly skilled (strategic outcome)
- Employee satisfaction
- Contribution from new product launches
- Average skill level points for the team
- Employee referral rate for open roles
Key measures vary based on organisation goals and stakeholder priorities. For instance, a retail business may focus on customer satisfaction and sales, while a manufacturer may emphasise efficiency, yield and quality.
Prebuilt Scorecards
Check out our three prebuilt scorecards that cover production, sales, and customer service.
Head to this page for three simple prebuilt scorecards covering production, sales and customer service (call centre).
Take Action
If you’re still using an outdated Balanced Scorecard, it’s time for an upgrade. KPI Trees don't just measure performance—they drive it, aligning your team around what really counts.
If you're implementing a BSC for the first time, reviewing a balanced scorecard example can provide clarity on structuring KPIs across perspectives. Find examples and seven steps to build your first one in our Ultimate KPI Tree Guide.