


How to Define KPIs with our KPI Format Sample
What is KPI definition?
KPI definition is the process of clearly breaking down the data, calculations and exceptions a team needs to know in order to reliably reproduce the metric being defined. Effective KPI definitions also support the processes of auditing management information, training new staff, and the creation of internal user guides and process cheat sheets. In this guide, we will show you exactly how to define KPIs using 10 easy steps. Download our free KPI format sample template to make this task even easier.
Why key performance indicators need to be defined
Key performance indicators (KPIs) exist to help us measure performance, identify opportunities, and to improve and track progress. They are the central tool in any kind of performance management which is crucial for good business strategy.
For our metrics to be effective, there are few essential elements:
- Our metrics need to be measurable.
- There must be a good mix of leading and lagging indicators, all of which should be carefully linked to our organisational strategic goals (which can be achieved by using KPI Trees).
- Our metrics must be presented using a well-designed set of reports and KPI dashboards.
The hidden problem with most metrics
The problem is all that design effort will be for zero benefit if the measure definition is poor, incorrect or worse, non-existent. Poor key performance indicator definition can lead to terrible personal and professional outcomes.
In nearly every business, there is a sneaky little issue lurking in the shadows - the so-called "common sense" problem. Most companies have a habit of giving their KPIs and measures names that sound pretty straightforward. But beware, because our clever brains are quick to jump to conclusions based on a name. We see a KPI name and immediately think, "Well, that's obvious, everyone knows that!" - even if it's just happening on a subconscious level. This can lead managers down a treacherous path of comparing completely unrelated KPIs just because they have similar (or identical) names, when in reality, their calculations are vastly different.
A (true) KPI definition horror story
A case of problematic KPI definition: Utilisation
Let us consider an illustration. A widely used metric in operations is known as 'utilisation'. Utilisation quantifies the percentage of employee time that was dedicated to billable work for clients. This metric is utilised in various industries, with a particular emphasis on professional service firms.
Defining the utilisation KPI
This is where things get interesting. Here’s a plain English definition of the 'utilisation' KPI:
‘Utilisation' is the ratio of billed hours to available hours for an individual.
That seems pretty simple, doesn’t it? But let’s look at some of the questions that this definition does not answer:
- For 'available hours', do you mean nominal, or actual, and do you include overtime?
- What about holidays or sickness absence - is that zero utilisation?
- By individual, do you mean only individuals who are billable or do you include support staff?
- Do you include mandatory commitments, such as safety training, in the available hours?
- What about sales? This is clearly a value-add activity but is not billable.
- What happens if you bill at a much reduced hourly rate? Does that utilisation count the same as full-rate work?
- What do you do with staff who have dual roles, only one of which is a billable position?
Now we see the problem: there is plenty of scope for misunderstanding here. It’s pretty rare to find a plain English definition that does not give rise to lots of similar questions. It looks like our initial definition has lots of holes in it. But how can we make sure that your definitions don't suffer from the same issue?
How to Define KPIs in 10 Simple Steps
If you're stuck on how to define KPIs, there is a simple tool that you can put into action today that will dramatically improve the quality of your KPIs and add a stack of professional credibility to your reputation. That tool is structured KPI definition using the ROKS KPI Canvas toolkit.
This toolkit is our unique KPI format sample template designed for any business owner or organisation. The ROKS KPI Canvas approach will sound very obvious and straightforward when explained, but based on 25 years of consulting experience, the author of this article can safely say that almost no organisations will have clear, thorough KPI definitions in place without first being exposed to the ROKS KPI Canvas.
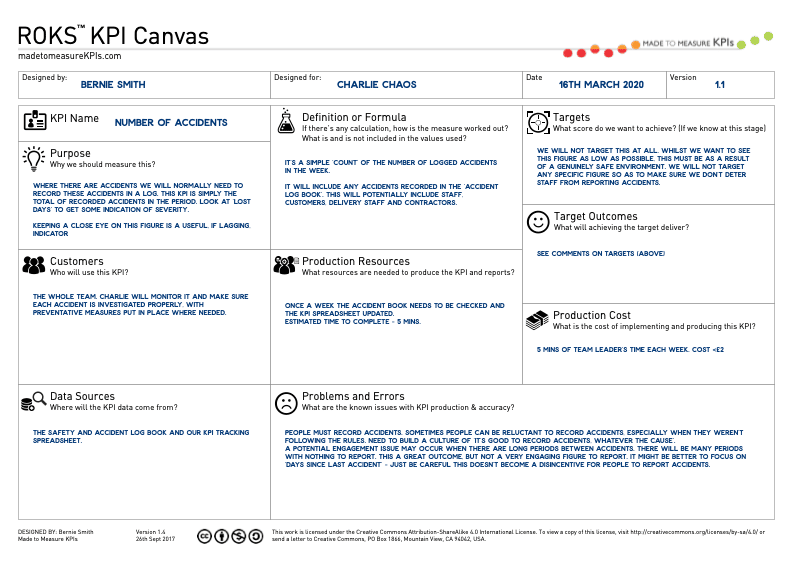
Coming up with clear, simple definitions doesn't have to be complex. We've laid out 10 easy steps for you to follow, along with an example at each step. Here's our example KPI definition template below.
Typical time to create first simple definition: 20 minutes
Things You Will Need
Method Steps
Step 1
Give your KPI a unique name
It is essential that management decisions are never made by comparing different measures that share an identical name.
To illustrate, if you have several measures that relate to efficiency, make sure you give them distinctive names such as 'Line 7 Bottling Efficiency', rather than just 'Efficiency'. The key thing is that there’s only one measure for with each name.
Example: Conversion rate (sales and marketing)

Step 2
Record purpose and description
Why should we measure this?
Sometimes we lose sight of why we are measuring something. This is particularly common in very top-down businesses where the boss might ask for some specific data - analysts are often too scared, or beaten down, to ask what it’s going to be used for. However, in the ROKS Enterprise Method, we would have already thought about the purpose of each measure in Step 4, the Shortlisting step - a powerful way of making sure we don't end up with too many key performance indicators - so this shouldn't be too difficult.
Conversion Rate Example: Conversion rate, in the context of marketing and sales, measures the ratio of conversions (signups, downloads, sales, etc.) versus the total number of visitors. It helps us focus on the quality of traffic we attract, rather than just volume.

Step 3
Identify your reporting customers - [Optional]
Who will use this metric?
We produce reports to help in decision-making. If you are a one-person business, then this is a very easy question to answer. If there are more people in your business, you need to have a clear understanding of who uses the data. That way, if a question comes up about how we measure or report something, we can talk to our KPI customer and discuss it with them instead of just trying to guess what they want. If there’s no clear customer or decision being made on the back of a KPI, you should seriously think about chopping it.
Conversion Rate Example: Typically the sales and marketing function of an organization, with oversight from the executive/c-suite.

Step 4
Identify data sources precisely
Where will the data come from?
One of the most common sources of errors in performance metrics comes from holding similar data in multiple places. If you have lots of spreadsheets holding data that is similar, but maybe slightly different in content or scope, then you have a real risk of mistakes creeping in. This is particularly true if you have more than one person involved in producing KPI reports. This field needs to go down to painful levels of detail.
Here's an illustration: rather than merely saying the data source is ‘From the production performance spreadsheet’, you should specify the name of the server the document lives on, the folder, the precise sheet name, the tab in the spreadsheet and the column-row range. Your test for whether you have done this properly is whether someone who hasn’t used this data before can successfully navigate to exactly the right data by following the instructions shown under Data Sources.
Conversion Rate Example: Depending on the specific kind of conversion being measured, the data sources might include:
- CRM (customer relationship management) system
- Ecommerce software (e.g. WooCommerce)
- Email response/signup rates

Step 5
Record KPI formula or calculation
If there’s any calculation, how is the measure calculated?
What is and is not included in the values used?
It’s important to be crystal clear about the calculation used, and what is and is not included in the calculation.
Conversion Rate Example: Conversion rate = 100 * [conversion outcomes]/[traffic volume]

Step 6
Document production resources - [Optional]
What resources are needed to produce the KPI and reports?
Sometimes you will need input from other teams or you will need a particular individual to provide or analyse data. It’s not uncommon to need data from a particular system or piece of software that only a specific person is able to extract. Knowing who, or what, you need to produce the data enables you to plan and spot dependencies that may cause problems.
Conversion Rate Example:
- Amy (marketing assistant) to input traffic volume and conversion outcomes from CRM and marketing automation platforms into Excel spreadsheet database.
- Edward (marketing manager) to calculate conversion from spreadsheet database and feed into marketing report.

Step 7
Set and record targets
What score do we want to achieve? (If we know at this stage)
Targets can get pulled out of thin air and can sometimes change over time. Record what target we are trying to achieve so that we have a record. If it changes, fine, but let’s record the new and the old, so we can see how things have changed.
If you want to get into much more depth on targets and incentives, check out 'GAMED: Why targets and incentives fail and how to fix them'
Conversion Rate Example:
- Initial Target: 15%
- Reasoning: This target is set based on historical performance data showing an average conversion rate of 10%. The aim is to improve performance by 5% over the next quarter, factoring in enhanced marketing strategies and sales training programs.

Step 8
Describe the benefits or purpose of the target
What will achieving the target deliver?
If you have nice round targets (10%, 50% or 100% improvement) ask ‘Why that particular figure?’. The most powerful and compelling targets are ones that are linked to outcomes.
Backup your targets with reasons, like this…
- If we achieve a turnover of $200k we can become a government approved supplier.
- If we undershoot our budget by $11,500 we can invest in a new espresso machine.
- If we cut downtime by 14% we can all have an extra day of vacation this year.
Using outcome-linked targets in your KPI definition can make them much more meaningful. Notices this format is very close to Objective Key Result (OKR) approach.
Conversion Rate Example: By attaining a 15% conversion rate, the business aims to reach a $500,000 annual turnover, qualifying it for a prestigious industry accreditation. This accreditation will open doors to new market segments, enhancing the company's reputation and driving sustainable long-term growth.

Step 9
Estimate production cost - [Optional]
What is the cost of implementation and production?
KPIs don’t come for free. Unless they are a 10 for Ease of Measurement/Availability, there’s time and effort involved in collecting and collating KPI data.
Conversion Rate Example:
- Data Systems and Software Costs:
- CRM Software: $100 per month for a mid-tier subscription.
- Marketing Automation Platform: $150 per month.
- Data Analytics Tools (Google Search Console & Google Analytics): Free.
- Human Resources:
- 30 minutes of Amy's (marketing assistant) time per month.
- 30 minutes of Edward's (marketing manager) time per month.

Step 10
Problems and Errors
What are the known issues with production & accuracy?
Pretty much all KPIs have issues. It’s one of the most common reasons I hear for not bothering to measure something - ‘We could try and measure that, but it’s pointless because…’.
All KPIs are flawed to some degree. They crunch question is; ‘Is the information delivered by the flawed KPI better than no information at all?’.
If the answer to that question is ‘Yes’, then we need to start collecting that data but be very clear and open about the problems and limitations of that KPI. This section is where we record, as honestly as possible, what the known problems and errors with the KPI and its source data are.
By keeping this record up-to-date we encourage ourselves to put the right level of trust in the KPI and also to try and fix the known problems.
Conversion Rate Example: The likely issues depend on the type of conversion rate being measured and the context. Here are some common concerns and issues:
- A good conversion rate for a single step in a sales process may not translate to a good final conversion rate (e.g. to a sale).
- Additional information may be needed for the 'why' behind a high or low conversion rate.
- A 'conversion' does not indicate the quality of that conversion and likely future outcomes.

Free KPI Format Sample: ROKS KPI Canvas Template Download
There is quite a lot to remember here. So here's the good news - you don't have to. All of these are covered in our free printable format sample, the ROKS KPI Canvas. Just fill in the form below to download your printable PDF template!
This KPI definition template serves as a structured memory-jogger to help you navigate through the key questions you need to answer in order to fully define your KPIs.
Here is what a blank ROKS KPI Canvas looks like:
Sign up and get this free download!
Copyright and Usage
The ROKS KPI Canvas is covered under the Creative Commons Attribution-NonCommercial-ShareAlike License. This license lets others remix, tweak, and build upon our work non-commercially, as long as you credit us and license their new creations under the identical terms. Full details live here.
Whether you fill it in using the forms capability of Adobe Acrobat Pro, print it out and cover it in Post-Its and ink, or recreate it in the software of your choice, it should help you properly define each and every one of your shortlisted KPIs. But only if you actually use it, of course.
Why are some bits of the ROKS KPI Canvas ‘Optional’?
As this method is focused on a wide range of business sizes, not all the steps in the method make sense for all sizes of organisation. If you are a sole trader, you really are not going to have to worry too much about who the ‘Customer’ for the KPI is, it’s clearly going to be you. Similarly, it’s fairly obvious what the ‘Production resource’ is going to be in a one-man-show too.
Looking for a jump start on your KPI definitions?
If you need a library of over 400 KPIs with explanations, worked examples and basic definitions, check out Getting Started with KPIs.
For topic-specific KPI Trees, including definitions, worked examples and notes for the most useful KPIs, check out our Premium KPI Packs.
How to share your KPI definitions with your team
Sometimes you need to explain a KPI to new team members, as part of training or as a refresher for existing team members.
Although the ROKS KPI Canvas can do this job pretty well, there is a tweaked format - called the KPI Cheat Sheet - which focuses more on the background and examples side of things.


")

