KPI Tree Meaning and Importance
Heard of a KPI Tree before? It's not a plant, but a visual way to see how Key Performance Indicators relate within an organisation. It's like a family tree, but instead of tracing your ancestors, you're mapping out the performance of different departments or processes.
Our Ultimate Guide to KPI Trees gives the official definition as 'a powerful visualisation method that allows an organisation's aspirations to be broken down into more granular results and relevant KPIs to track those results using a clear hierarchy. KPI Trees also enable you to visualise complex relationships, conflicts and interdependencies within an establishment.' It's not just about streamlining how you monitor performance, but shining a light on all the intricate relationships, potential conflicts and interdependencies within a company's setup.
This method of designing key performance indicators was invented by our founder, Bernie Smith, in 2011 and first appeared in his book, KPI Checklists (published 2013). Understanding their importance for every organisation out there, Bernie meticulously crafted three KPI Tree diagram samples for you to use - absolutely free. You can grab them below but be sure to continue reading for a breakdown of the role of KPI Trees in strategy as well as some tips for using them effectively.
3 Essential KPI Tree Examples by the Inventor
Bernie is an experienced performance management specialist who has been consulting for almost 20 years. He has written over 20 books on the subject and has created countless KPI Tree charts for clients. He has also produced a number of high-impact online courses teaching on every facet of performance measurement through his dedicated education site, KPI Academy.
The three Trees available below are extracts from a library of 52 pre-built Trees that are part of the ROKS KPI Tree Library. Students of Bernie's flagship course, the ROKS KPI Black Belt programme, have full access to all 52 KPI Trees and over 400 full KPI definitions.
1. Finance KPI Tree Example
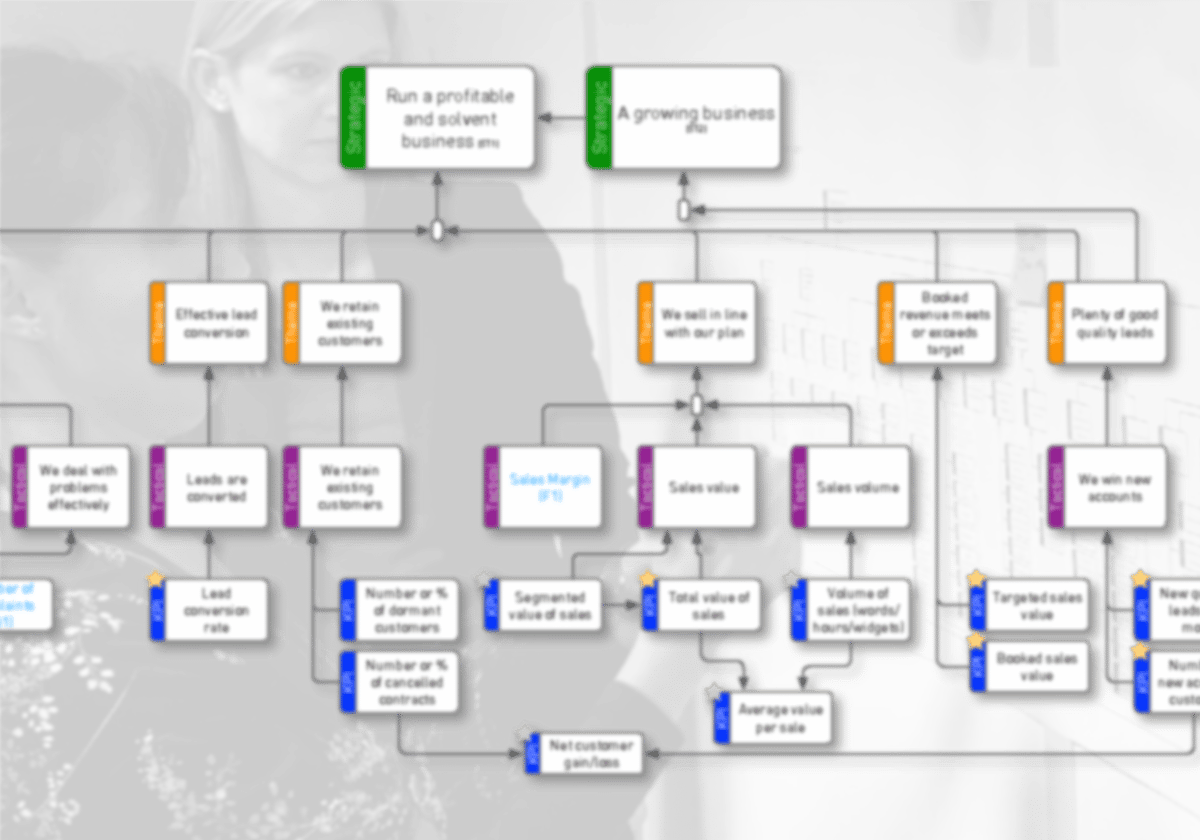
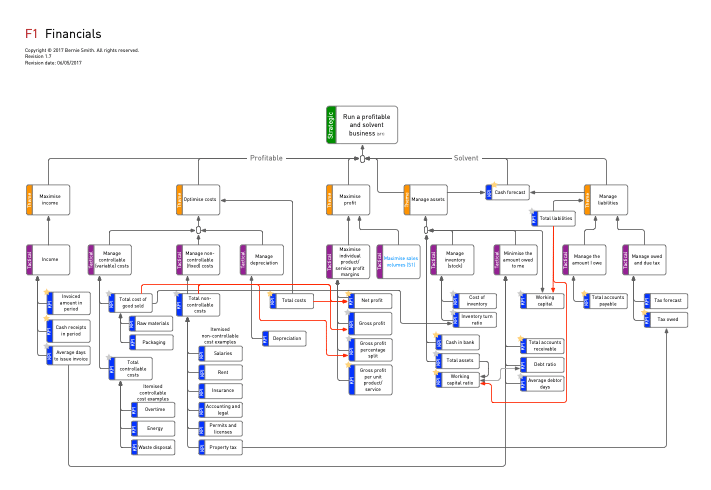
This first of our KPI Tree examples is a financial KPI Tree illustration. It shows many of the core financial metrics examples and outcomes for a typical organisation structured using this hierarchical framework.
2. Service Improvement KPI Tree Example
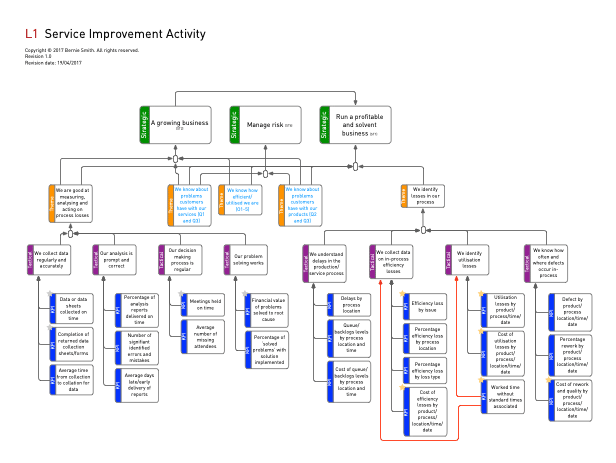
This service improvement KPI Tree visualisation shows how we can rapidly develop the candidate metrics for an organisation that intends to improve the service it offers. The download offers an illustration of a potential service improvement KPI Tree structure that can be expanded upon or tailored to fit your needs.
3. Product Quality KPI Tree Example
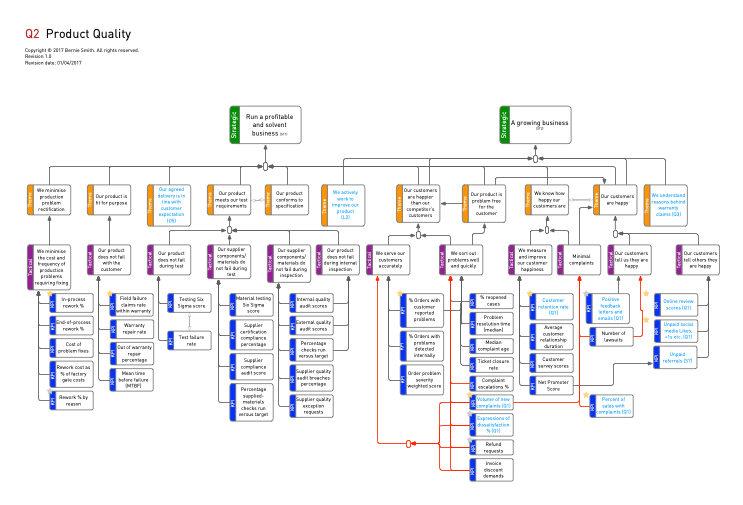
Our final KPI Tree example encompasses quality metrics for products. This would be the start point for a business with physical products that wants to set up meaningful product quality KPIs. Our illustration also serves as a great starting point containing plenty of product quality metrics examples.
Role of KPI Trees in Strategy
Bernie understands just how valuable a KPI Tree chart can be for an organisation as it is arguably the fastest way to turn strategy into measurable outcomes. The ability to take an overarching strategy and break it down into a hierarchy of objectives and their corresponding metrics is immensely powerful.
A properly constructed KPI Tree does several things to drive organisational strategy:
- Translates strategy into tangible, measurable goals at every level of the organisation
- Creates alignment between top-level aspirations and day-to-day operations
- Identifies how various departments and processes impact key objectives
- Highlights potential metric conflicts across units to address early on
- Enables data-driven decision making and resource allocation
The beauty of the KPI Tree lies in its ability to cascade strategy in a methodical way that unites stakeholders at all levels. Rather than departments operating in silos, everyone shares an understanding of how their contributions tie back to core strategic goals. This level of transparency and accountability has been shown to rapidly accelerate execution and breakthrough organizational inertia. In essence, the KPI Tree brings strategy to life - illuminating a clear path from vision to results.
Using KPI Tree Diagrams
Each of the above illustrations serve as a KPI Tree structure example to get you familiar with how these visualisation tools look and feel. KPI Trees are an essential part of the process of designing key performance indicators.Bernie created a proprietary step-by-step method for performance measurement of any organisation called the Results-Orientated KPI System, ROKS for short.
The most important thing to remember when using KPI Tree diagrams is that these guys are part of only a single step of the ROKS method. KPI Trees intentionally generate a large amount of metrics, oftentimes too many to practically implement. We are not committing to measuring all of these KPIs - this step is what we call 'longlisting' which is Step 3 of the ROKS method. Once we have built our KPI Tree chart, we use the shortlisting approach in Step 4 to cut the list down to the most useful and practical set of KPIs.
What makes the KPI Tree approach so valuable in situations like this is showing how the KPIs interact and which outcomes they drive. The beauty of this approach is that is also makes it easier to spot gaps and mistakes in our thinking, so if you see something you passionately disagree with why not get in touch?
We created the Ultimate Guide to KPI Trees containing a step-by-step KPI Tree setup manual for anyone wanting to tackle the task of building KPI Tree visualisation themselves. And to help you even further, we have a dedicated blog page covering KPI Tree Tools and Templates to help you with the technical aspects of generating these nifty charts. But it doesn't stop there... Keep scrolling to find our done-for-you KPI Tree options that will get you going ASAP!
More KPI Tree resources
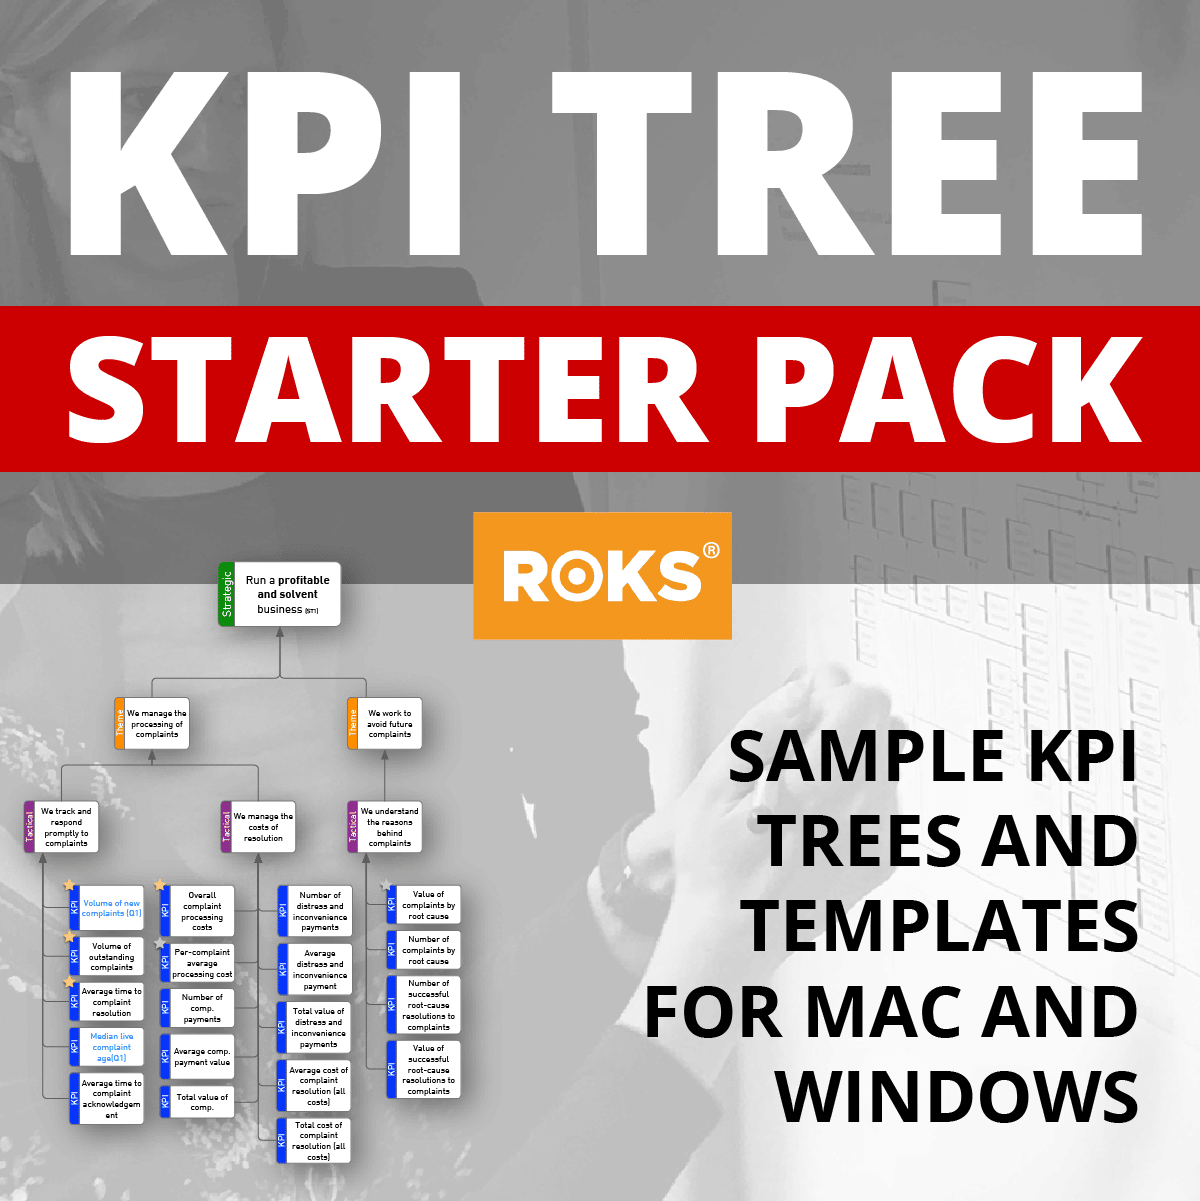
KPI Tree Starter Pack
The KPI Starter pack gives you the tools you need to start building your own KPI Trees straight away. That pack contains...
Sample KPI Tree PDFs...
- Service Quality KPI Tree
- Complaints and Incident Handling KPI Tree
- Finance KPI Tree
KPI Tree Templates
- Visio KPI Tree Template (for Windows users, desktop Visio only, not cloud)
- OmniGraffle (for MacOS users)
- PowerPoint template (for simple KPI Trees on any platform that supports Microsoft Office)
Premium KPI Tree Packs
Sometimes you just need a menu of good KPIs to pick from. That's what this 'Essential KPIs' series of guides are designed to provide. The problem is that not every business is the same.
So, how do you make sure you fully understand where the KPIs in this pack came from and identify any extra KPIs that may be specific to your organisation? You do this using KPI Trees show the outcomes that each KPI is designed to reflect, so you can understand the logic and reasoning behind each and every KPI in the pack and build on it to identify KPIs specific to your organisation.

