


Ultimate KPI Tree Guide: What Is a KPI Tree & How to Build KPI Trees That Work
A KPI Tree is one of the most effective ways to translate strategy into meaningful, measurable performance indicators. It shows (visually and unambiguously) how every KPI links back to strategic objectives, and how metrics interact, reinforce, or conflict with one another.
This guide explains what a KPI Tree is, why KPI Trees work, and how to build a KPI Tree step‑by‑step using the original KPI Tree method developed by Bernie Smith, creator of the ROKS (Results-Oriented KPI System).
WATCH: KPI Trees Explained in 3 Minutes
This 3-minute video walks you through the basics of KPI Trees.
Who Should Use KPI Trees?
This guide is for:
- Executives translating strategy into measurable outcomes
- Strategy, performance, transformation and PMO leaders
- KPI owners frustrated with disconnected or meaningless metrics
- Consultants and analysts designing performance frameworks
- BI/analytics owners designing dashboards
- Anyone interested in becoming better at strategic thinking and performance management
If you need KPIs that people trust, understand, and use, KPI Trees provide a proven foundation.
Quicklinks

KPI Tree Basics: Purpose, Structure & Origins
What Is a KPI Tree?
A KPI Tree is a visualisation method that decomposes high‑level strategic objectives into progressively more granular outcomes and KPIs. Each level of the Tree shows what must happen for the level above to be achieved.
KPI Trees are designed to:
- Clarify how strategy is delivered in practice
- Expose hidden assumptions and trade‑offs
- Prevent KPIs being selected in isolation
- Support collaborative, cross‑functional decision‑making
KPI Trees also make it possible to visualise complex interdependencies and conflicts; for example, where improving one KPI may damage another or undermine the overall objective.
Where Did KPI Trees Come From?
KPI Trees were invented by Bernie Smith in 2011 and his KPI Tree method was first published in his book, KPI Checklists, in 2013. It forms the longlisting step of the ROKS (Results-Oriented KPI System) methodology.
The method builds on earlier concepts such as:
- Driver Trees (from P‑M Analysis in the Toyota Production System)
- Strategy Maps (Kaplan & Norton)
However, KPI Trees are specifically structured to support comprehensive KPI identification, not just strategy communication.
Why Use a KPI Tree?
Most strategic objectives are high‑level outcomes, expressed in broad language. Without a structured approach, KPI selection often becomes subjective, political, or inconsistent.
For example, it is difficult to agree with confidence that measuring process moisture content will deliver lowest cost per metre production unless the relationship between the two is explicitly understood.
KPI Trees solve this problem by forcing clarity about:
- What drives success
- How outcomes are connected
- Which KPIs genuinely matter
They ensure that every KPI can be traced back to a strategic objective—and challenged if it cannot.
5 Powerful Benefits of KPI Trees
KPI Trees are all about breaking down vague aspirational goals into meaningful metrics. Here are five powerful benefits they provide:
All of this means you choose meaningful and productive KPIs that improve data-driven decision-making. If you don't use an approach like this, then your KPIs are normally the measures that the biggest personality in the room wanted.
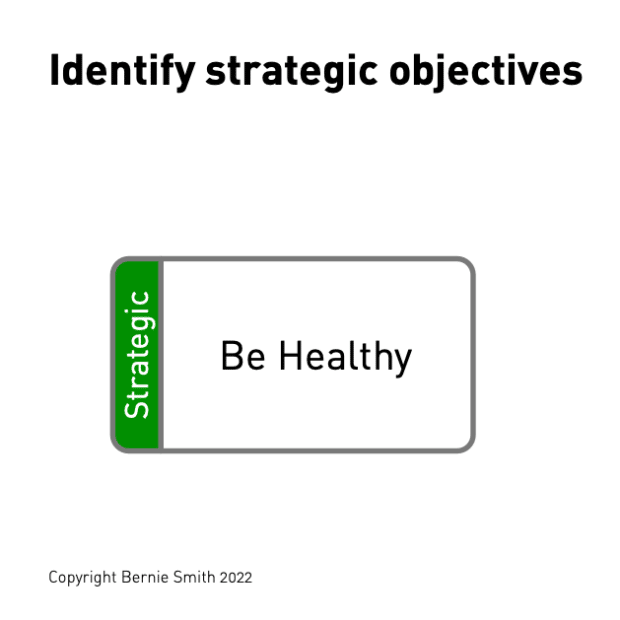
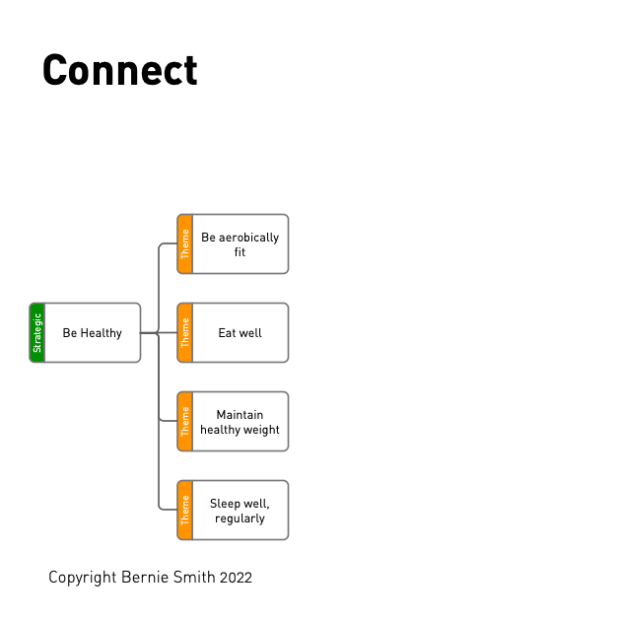
What Does a KPI Tree Look Like? (Real Example)
Below is a fully worked KPI Tree example developed for training purposes. It shows how a single strategic objective, “Be Healthy”, is broken down into outcomes, drivers, and KPIs, with clear cause‑and‑effect relationships.

The Anatomy of a KPI Tree
A KPI Tree has a simple, repeatable structure that makes even complex strategies easier to understand and discuss. Each level of the tree represents a different type of thinking, moving from strategic intent at the top to measurable indicators at the bottom.
The original KPI Tree design created by Bernie Smith uses colour deliberately to make this structure immediately recognisable and easy to follow. The colours are not decorative; they act as visual cues that help teams stay oriented as they build and review the tree.
A standard KPI Tree has four levels:
Why the Colours Matter
Using a consistent colour scheme makes KPI Trees easier to:
- Build collaboratively in workshops
- Review and challenge
- Explain to stakeholders
- Maintain over time
Most importantly, the colours reinforce discipline: every KPI must connect back through purple, orange, and green to a strategic objective… or it doesn’t belong in the Tree.

How to Build a Killer KPI Tree in 7 Easy Steps
KPI Trees are powerful and easy to read, but building them can be a little tricky the first few times you do it. Follow these seven steps for a tried-and-tested approach to build your KPI Trees.
Typical time to draft a KPI Tree: 2 hours
Things you will need
ROKS KPI Tree Method
Step 1
State your long-term goals
Start with the basics - what are you trying to achieve? Review any existing mission, vision and senior approach documents to find your company's goals and then boil them down into simple, clear, single-phrase sentences that anyone could understand.
This is the Strategic level (green boxes).
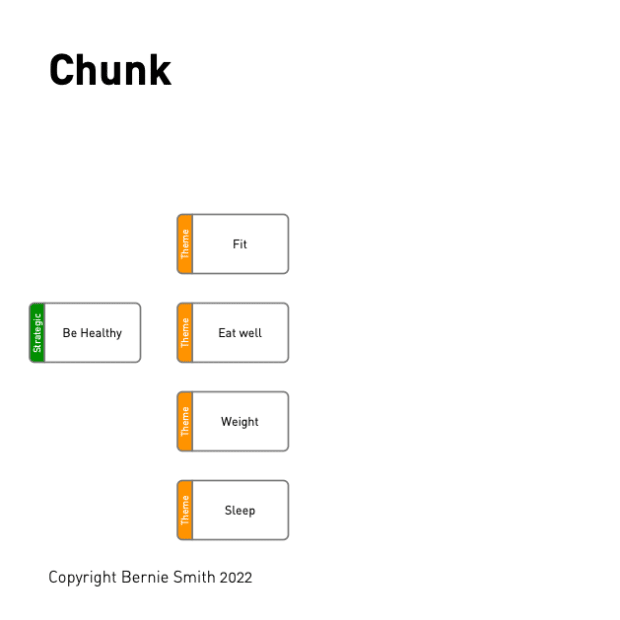
Step 2
Chunk - Break down your high-level goals into smaller results and outcomes
This step involves identifying the outcomes that directly affect the box that we are 'Chunking'. In other words, take those big goals from Step 1 and split them into the smaller outcomes they're made up of, one big goal at a time. This is the Theme level (orange boxes).
Let's use "Be healthy" as an example of a big goal. What affects that? Things like:
- Good quality, regular sleep
- Diet
- Aerobic fitness
- Body weight
- Stress levels
- Managing/eliminating unhealthy habits
All of those things make up the 'Chunks' (or drivers) for the big goal of "Be healthy".
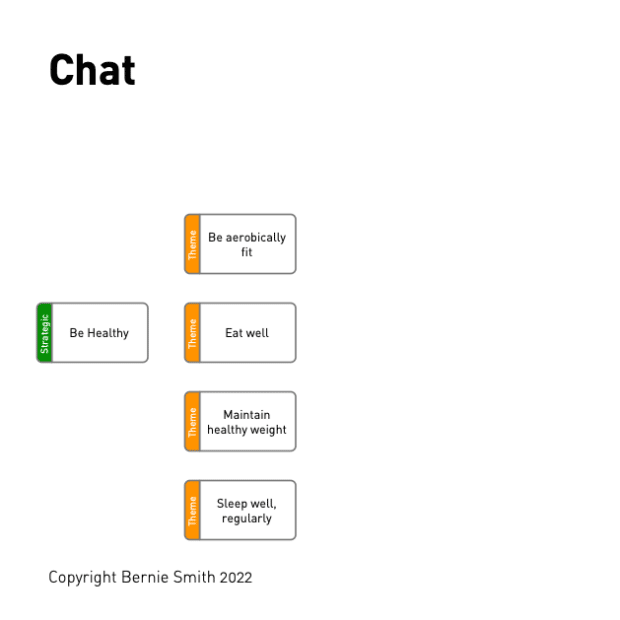
Step 3
Chat - Tune the wording of your tree
Wording matters. One or two words aren't enough - they're too vague and can be easily misunderstood by others. Use 5-10 words, including rich descriptive language, to really spell out what you mean for each Chunk. Here is a handy guide for how to write goal statements - use our three basic steps to perfectly describe your drivers (Chunks).
Step 4
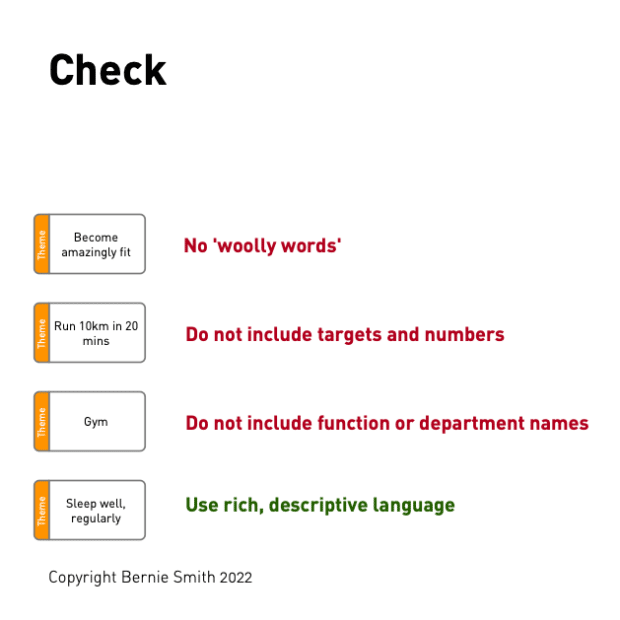
Check - Look out for common mistakes and issues with KPI Trees
Watch out for these traps:
- Using department names instead of what they actually do (say "We recruit appropriately skilled people" not just "HR")
- Including targets and numbers in the description. This can be highly emotive. Targets should only be set once a KPI has been agreed as being important (shortlisting), i.e. not during the KPI Tree build process
- Using woolly words like "world-class" or "brilliant" - these sound great but are actually vague and difficult to define, making assembling KPI Trees much harder
Make sure to avoid these common mistakes and aim to use rich, specific and descriptive language.
Step 5
Connect - Use connectors to show relationships and interactions
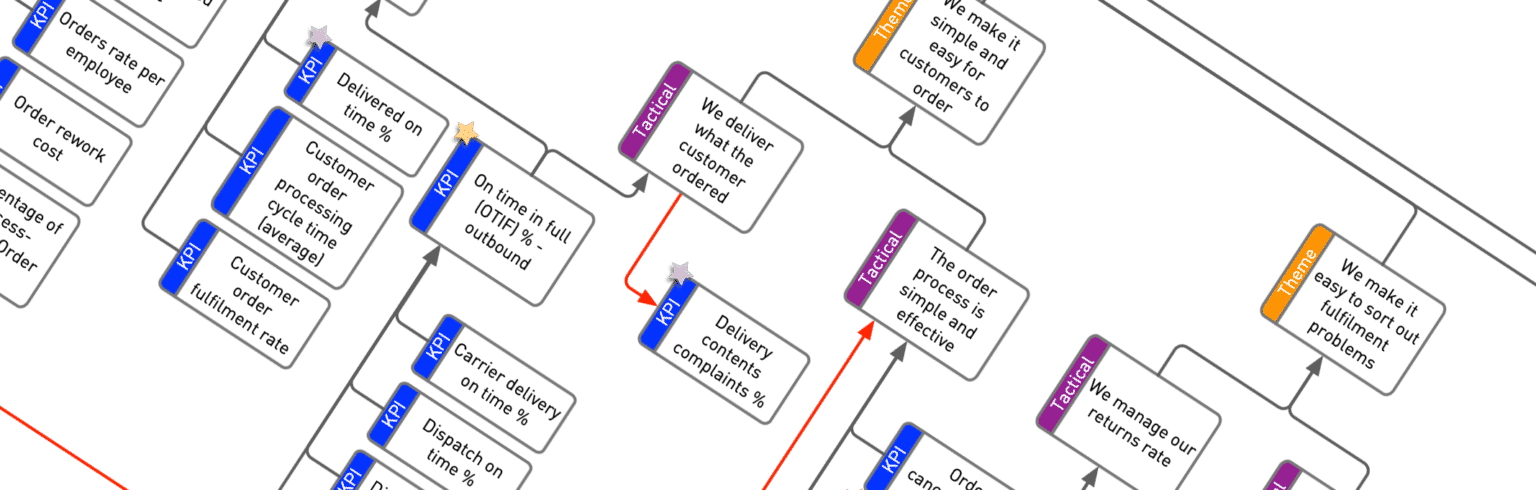
Boxes on the KPI Tree can be linked to any other to show a relationship. There are two main link types...
Link type 1 - Cause and effect
Where one activity directly influences another. This the most common type of relationship, so we use a plain grey line for this.
Link type 2 - Conflict
Where one activity conflicts with another. Use a red line to show this. A red link often indicates mutually exclusive end results.
Step 6
Repeat Chunk, Chat, Check, Connect Process for next layer
Go through steps 2-5 again for each orange box (Theme level), creating purple boxes (Tactical level) underneath.
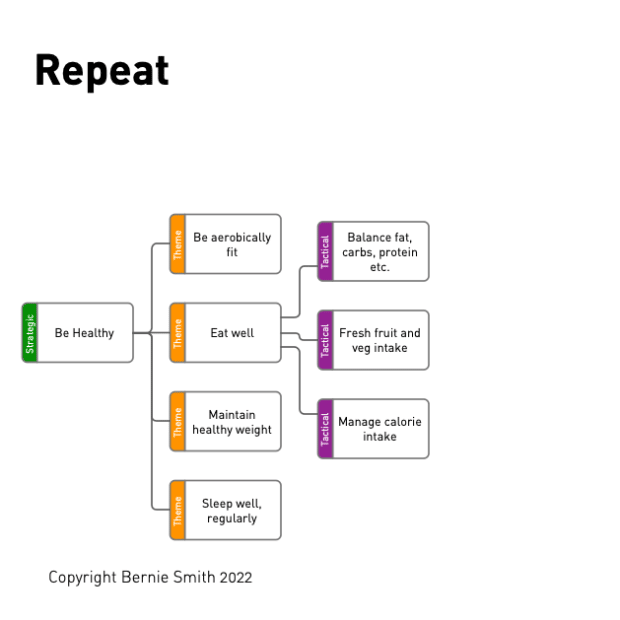
Step 7
Identify KPIs for lowest-level end results on tree
By the time we get to the Tactical (purple) level, it should be very easy to identify relevant KPIs at the final level below that (blue boxes).
For example, if you're looking at "Manage calorie intake", you might measure:
- Body Mass Index
- Calories consumed
- Weight
- Alcohol intake
Repeat these steps until you have filled out your whole KPI Tree.
The beauty of this? You end up with all your possible KPIs laid out clearly. Then you can use Bernie's Shortlisting method to pick out the ones that really matter.

Your Next Step with KPI Trees
- Want to build your own KPI Tree quickly? → KPI Tree Studio
- Want proven KPI Trees and definitions? → KPI Packs
- Want the full methodology? → KPI Checklists
- Want mastery and certification? → KPI Black Belt
Watch our free webinar on 'How to Build a KPI Tree' now!

A 40 minute session covering...
- What KPI Trees are and when to use them
- Demonstration, assembling a real-world KPI Tree
- Five tips on getting the most from your KPI Trees
The session will include useful free downloads and a brilliant offer on Bernie's KPI Tree Starter Pack, which includes powerful cheat-sheets and completed KPI Tree examples.
More Examples
Here's an example of it all being put together. It's the 'profit’ branch from a Financial KPI Tree Bernie built for his latest book. Sign up using the form below if you would like the full KPI Tree sent to you by email as a PDF. The downloadable version includes the 'solvency' branch too.
Need more examples? We’ve got two more free downloadable sample KPI Trees covering service improvement and product quality.
And if you want something ready to use straight away, pop over to our KPI Tree store. We've got loads of pre-built KPI Trees ready to put into action in your business immediately.


Tools for Building KPI Trees
Build KPI Trees faster and more consistently with KPI Tree Studio, the dedicated software tool designed specifically for the KPI Tree method.
However, there are several other choices for drawing KPI Trees. Key points you need to consider when choosing one are:
- Does the read/edit software have to be a standard desktop application (like KPI Tree Studio, Microsoft Word or PowerPoint) or do you have to install specialist applications (like Visio or Aris)?
- What is the IT skill level of the users?
- Do you have to attach meta-data to objects? If so, you will need to go for a more specialist rendering package, e.g., Visio.
- Is there a company standard currently in use for this type of graphical display? E.g., Mindjet, mind mapping software.
- Will the software be used on a variety of operating systems? Some applications like OpenOffice, Freemind and Mindjet cover two or more operating systems. Others, such as Visio, tie you firmly to one platform.
- What level of annotation and general sophistication are you looking for? How many nodes/branches do you need to fit in?
We have an entire guide dedicated to breaking down the different KPI Tree drawing tools and options available to you, which include free resources, as well as our done-for-you templates at our KPI Tree Store.
Where Can You Use KPI Trees?
Here's the brilliant thing about KPI Trees - as long as you can clearly spell out the end result you want, you can use them for pretty much anything. Want to manage products better? Check. Looking to boost innovation? Perfect. Starting a new business? Absolutely.
They're fantastic at making sure everyone's pulling in the same direction, from the top brass right down to the shop floor. Need some ideas? Our KPI Tree store is full of ready-made packs that'll save you loads of time and give you tons of inspiration.


KPI Tree vs Metrics Tree: What's the Difference?
Let's break this down in simple terms - while they might sound similar, KPI Trees and metrics trees do different jobs. Here's how:
What they're for:
- KPI Trees show how well you're doing at hitting your big business goals
- Metrics trees track how your day-to-day work is flowing (using what we call a metrics tree model)
How they're built:
- KPI Trees start with the big picture at the top and work down
- A metrics tree starts with the ground-level stuff and builds up based on workflows
What they measure:
- KPI Trees look at whether you're getting the strategic outcomes/results you want
- The metrics tree checks if your everyday activities are running smoothly
When to use them:
- KPI Trees help bosses make big decisions about where to focus resources
- Metrics trees help teams spot where to make their work more efficient
In summary, KPI Trees help you achieve your mission, while the metrics tree model helps you run things better. Most organisations actually use both - KPI Trees for the big picture stuff, and metrics trees for keeping an eye on the day-to-day operations.
KPI Trees vs Other Strategy & Performance Frameworks
There are quite a few widely cited performance measurement frameworks. One should be careful because they are not freely interchangeable. Your framework should be chosen based on your primary purpose.
We've built a comparison table below to help you understand the differences between a few frameworks and where best to use each:
| Framework | Primary Purpose | Focus | Strengths | Limitations | When to Use |
|---|---|---|---|---|---|
| KPI Tree | Identify and structure KPIs | Outcomes, drivers, metrics | Explicit KPI identification, shows conflicts, links every KPI to strategy | Can generate many KPIs (requires shortlisting) | When designing or fixing KPI systems |
| Strategy Map | Communicate strategy | Strategic themes | Clear narrative, executive alignment | Weak at KPI identification | When explaining strategy |
| OKRs | Drive execution | Goals & stretch targets | Focus and momentum | Not a KPI system | When driving short‑term execution |
| Balanced Scorecard | Organise KPIs | Perspectives | Familiar structure | KPIs often pre‑selected | When structuring existing KPIs |
| Driver Trees | Analyse causes | Process drivers | Root‑cause analysis | Not KPI‑focused | When diagnosing problems |
Your Next Step with KPI Trees
- Want to build your own KPI Tree quickly? → KPI Tree Studio
- Want proven KPI Trees and definitions? → KPI Packs
- Want the full methodology? → KPI Checklists
- Want mastery and certification? → KPI Black Belt
So, now you're up to speed on what a KPI Tree is and how powerful they can be when you use them. Want to use KPI Trees with your team? Let us show you how to run a proper KPI Tree Workshop.
We've broken it down into simple checklists that really work:
So, now you’re up to speed on what a KPI Tree is and why it can be so powerful. The next question is: how do you actually build one with your team?
In practice, creating a robust KPI Tree is best done collaboratively and usually involves at least two live workshops with the right people in the room. To help you plan and run those sessions well, we’ve put together four detailed checklists covering preparation, practicalities, and how to facilitate each workshop.
You’ll notice the checklists assume an in-person format and refer to a whiteboard, pens, and Post-its. That’s a proven approach—but it’s not the only one. If you’d like to build KPI Trees digitally, KPI Tree Studio is a dedicated tool that helps teams create Trees faster and more easily. It provides drag-and-drop boxes and connectors to speed up structuring, as well as high-quality AI support for moments when the group needs inspiration or alternative ideas. Once your Tree is complete, you can export it in multiple formats or share a viewing link.
Whether you go analog or digital (or combine both), the key principle stays the same: a KPI Tree is strongest when it’s built as a team effort and agreed together.
For more practical, straight-talking advice on KPI Trees and choosing the best KPIs, check out Bernie's book KPI Checklists
Your Next Step with KPI Trees
- Want to build your own KPI Tree quickly? → KPI Tree Studio
- Want proven KPI Trees and definitions? → KPI Packs
- Want the full methodology? → KPI Checklists
- Want mastery and certification? → KPI Black Belt
I’ve Built My KPI Tree – What’s Next?
Great work getting your KPI Tree together! But that’s just one step in the ROKS method (Results-Oriented KPI System). Your KPI Tree gives you a longlist of potential KPIs – now let’s take it to the next level.
Here’s what to do next:
Follow the ROKS Approach
Want the full picture? We’ve got you covered with:
- An explainer, showing all steps of the ROKS method
- Links to resources for each step of the ROKS method along with some helpful videos from our KPI Academy courses
But if you’re itching to dive in, here are the key steps after building your KPI Tree:
- Shortlist Your KPIs
Go through your KPI Tree and pick the KPIs that matter most. Focus on importance and ease of measurement. - Define Your Shortlisted KPIs
Use the ROKS KPI Definition Canvas to properly define and refine each KPI. Need help explaining it to your team? Grab our KPI Cheat Sheet – it’s perfect for onboarding new joiners and getting everyone on the same page. - Draft Dashboards and Reports
Start sketching out how you’ll present your data. Think about what your team needs to see, and make it easy to understand at a glance. - Go Live
Roll out your KPIs, dashboards, and reports. This is where all your hard work pays off – your new system is ready to drive results!
Getting Buy-In for Your New KPIs
Getting buy-in starts well before you begin building your KPI Tree. Check out our blog post covering How to Get Staff Buy-In for KPIs in 5 Steps.
Once you've got a KPI Tree built, here’s a smart way to spot any gaps and get people on board even further:
Ask your team this question:
"Thinking about the last few problems that hit your desk, where would they show up on this Tree?"
If your Tree’s well-designed, every issue should show up on at least one metric. If it doesn’t, you might’ve missed a branch or two – go back and tweak your Tree.
Remember: KPIs won’t solve problems for you, but they should light up when problems happen so you can take action.
Need a KPI Tree Head Start?
Good news: Many organisations share similar KPI needs. Financial, operational, and HR KPIs, for instance, often look pretty similar across businesses.
That’s why Bernie has built 52 foundation KPI Trees, based on common traits across organisations. Even better, we’ve narrowed it down to the 13 most popular packs, each including:
- Pre-built KPI Trees
- Supporting templates
- Fully defined KPIs ready to print and use
Want to save time? Grab one of these packs and hit the ground running.
For Advanced Practitioners
For experienced practitioners who want to master KPI design and become certified experts in the ROKS method, the KPI Black Belt programme provides advanced training and formal certification.

Need Help Building Your KPI Trees?
Bernie regularly helps clients produce custom KPI Trees. This can be done remotely or on-site. Get in touch using the form below for a free initial chat about your needs.


