


5 Key Performance Index Examples You Use Everyday
Key Performance Indicators (KPIs) are essential for businesses to measure their progress towards achieving specific goals and objectives. They serve as quantifiable metrics that provide insights into the success or challenges within various areas of a company's operations. Lots of performance managers are well aware that keeping an eye on the correct KPIs can turn into a real time-consumer when you've got, let's say, 40 of them. Introducing: the key performance index, also known as a composite index or a composite KPI.
Key performance indexes - or index KPIs as I call them - are a hugely powerful method of condensing multiple metrics into a single KPI. In fact, index KPIs are such a revolutionary tool that you actually use them every day and probably don't even think of them as indexes. Chances are, you've never even thought about creating your own performance indexes, which means you could be totally clueless about the perks they offer. Don't miss out on the opportunity to up your game! Check out this Ultimate Guide to Brilliant Index KPIs for all you need to know about these magical measures in one place or keep scrolling for our common examples.
5 Common Key Performance Index Examples
In this blog post, I will highlight five common key performance index examples that you probably use everyday to show how pervasive and useful they can be. By delving into these index KPI illustrations, we can gain a better understanding of their significance and how they can be utilized to drive success in various aspects of a business. Let's explore each of these performance index examples in more detail.
If this post fires you up to create your own powerful composite indexes, check out our 90-minute training course and Excel toolkit or head on over to our Ultimate Guide to Brilliant Index KPIs to learn more.
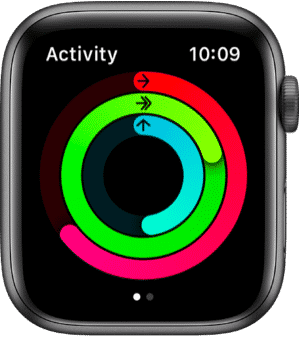
Example 1: Apple Watch Activity Scores
The Apple Watch Activity Score is a performance index that measures how active you are. Although the concept is simple, it can be tough to summarise.
What the Apple Activity Score shows
We make thousands of movements each day. We stand, sit, run and move around, causing rises and falls in our heart rate. Summarising our activity manually has the potential to be unbelievably tedious. The Apple algorithm takes hundreds of thousands of data points and creates a simple three-metric overview, showing a score for...
- Exercise - our higher intensity activity, presented as a single score. Here's how Apple describes it: The exercise ring on the Apple Watch (part of the Activity app) requires activity above a "brisk walk" - with a sustained increase in heart rate for at least 1 minute - to earn points. Every full minute of movement that equals or exceeds the intensity of a brisk walk will count towards your daily Exercise and Move goals.
- Movement - our lower intensity activity scored alongside a calculated calorie consumption.
- Stand - the hours in the day where we have stood up at least once shown versus our total waking hours.
Apple also uses tailored, adaptive, targets to keep the user motivated or engaged (or at least that is the theory).
How the Apple Activity Score is calculated
It seems to be a secret! There is general advice on what 'counts' towards the scores, but no details of how it is calculated. It's a proprietary algorithm, so I don't expect to see this in use in any non-Apple products at any point in the future.
Example 2: The S&P 500 Index
The S&P 500 Index is a stock market indicator that tracks the performance of major U.S. firms.

What the S&P 500 tells us
The S&P 500's primary goal, like all stock market indices, is to give an overview of the performance of the stock market (and the U.S. economy). It includes data from roughly 80% of the market capitalisation of all U.S. stocks and reflects activity from approximately 500 leading companies in the United States.
How the S&P 500 Index is calculated
The value of the S&P 500 Index is derived using a free-float market capitalisation-weighted method.
- The first step in the calculation is to determine the market capitalisation of each component in the index, which is known as the free-float market capitalisation. The free-float market cap is the aggregate value of all shares of a company currently available on the market (price x number)
- Next, the market capitalisations for each of the companies in the index are summed.
- Finally, that sum is divided by the 'Divisor' (currently around 8.3 billion), which is a number that is adjusted to keep the value of the index stable despite corporate actions that affect market capitalisation. When a company leaves the S&P 500 Index and is replaced by another with a different market capitalisation, the divisor is adjusted so that the value of the S&P 500 Index remains consistent.

Example 3: Exam Grades
Another very common type of performance index that you almost certainly don't think of as a performance index, is an exam grade.

What exam grades tell us
Exam grades offer a simple assessment of a student's understanding of a body of knowledge. Years of professional education and training can be distilled down to a single number or letter, in the form of a degree grade.
Exam grades, whilst not perfect, help society function by avoiding the need for detailed, expert probing every time we need to establish a person's expertise in a given subject, perhaps during a recruitment process. Grades give a quick and simple summary of a person's knowledge of a given field.
How the exam grades are calculated
There is no single method, as it varies by country and educational level. The basic principle is simple and so commonly used that we usually don't give it a second thought:
- Students are assessed through an exam or practical exercise.
- Those scores are then aggregated into a single result.
- That aggregate score is then mapped onto a 'result'. For example 'Upper Second Class degree', if you are in the UK, or 'GPA' if you are in the US (which also includes a divisor based on 'credit hours').
Example 4: Driving Eco Score
If you drive a hybrid vehicle, there's a very good chance it will display an 'Eco' score, to show you how efficient your driving is.

What the Driving Eco Score tells us
The Driving Eco score is a measure of how efficiently you are driving your hybrid car. It takes into account factors such as braking, accelerating, and speed, to give you a score between 0 and 100. The higher the score, the more efficient your driving is.
How the Driving Eco Score is calculated
Like the Apple Activity Score, this is usually a proprietary algorithm (calculation), so there's no standard to allow comparison between vehicles produced by different manufacturers. Like the Apple Activity Score, the Eco score is entirely designed to 'gamify' the process of driving economically. The simple, at-a-glance, nature of the score is crucial in developing user engagement. Here's a great example of where this gamification worked.
Example 5: Weight Watcher Points
Weight Watcher points offer a simplified system for the complex business of balancing measuring nutritional value, energy intake, exercise, and personal metabolic requirements.

What Weight Watcher points tell us
The Weight Watcher approach recognises that weight management is not just about calories, but should also factor in nutritional value and energy expenditure.
How Weight Watcher points are calculated
Weight Watchers have evolved how the points work. Historically, points were calculated as...
p=(c/50) + (f/12) - (min{r,4}/5)
where min{r, 4} equals the number of grams of dietary fiber or 4, whichever is smaller. So only the first 4 grams of fiber 'count', above that the value is capped at 4.
- p = Points
- c = Calories
- f = Fat Grams
- r = Dietary fiber Grams
Whilst the formula is in the public domain, it is patented. At the end of 2015, a new points system, Beyond the Scale, was established by the company. The program assigns food types points based on their nutritional values, providing members a set number of Smart Points each day (and week).
The new 'Smart points' are based on calories, sugar, saturated fat, and protein, but certain foods, such as fresh fruit, flagged as 'zero-point' foods. The nutrients from fruits and vegetables are only factored in if they are mixed with other food.
Here is how it is calculated...
(Calories * .0305) + (Sat Fat * .275) + (Sugar * .12) - (Protein * .098)
Bonus Examples
Here are a couple more commonly used index KPIs in the realm of manufacturing. Click on the links to read more about what they are.
- OEE: an efficiency measure.
- Yield: a material conversion metric for manufacturers. Customer satisfaction score: a metric used to measure how satisfied customers are with a product or service.
Check out our Key Performance Index: Frequently Asked Questions page for more burning questions you might have.
What could a performance index do for your business?
A performance index can provide a comprehensive overview of the performance of various aspects of your business, allowing you to identify areas of strength and areas needing improvement. With a index KPI, you can easily track and measure progress over time, compare performance across different departments or teams, and make data-driven decisions to optimise business operations.
To dive into some more benefits of index KPIs, head over to our Ultimate Guide to Brilliant Index KPIs where you'll find an in-depth definition, more examples, benefits and a walk through of our system to create them!
I'm hoping that after reading this post, you will start to notice how often index KPIs pop up in unexpected places and how useful they can be. It's over to you now to build your very own performance index! If you are looking for a structured method and toolkit to help you do this, don't forget to check out our 90-minute training course and Excel toolkit.
In addition, make use of our Ultimate Guide to Brilliant Index KPIs and our Key Performance Index: Frequently Asked Questions page for more detail and to get in touch if you need hands-on assistance.
? A Guide with Examples")


")