KPI Cheat Sheet – Making KPIs and Measures Easy to Understand

Most KPIs are really badly documented, if they are documented at all
No matter which industry, I find three things are consistently true of KPIs
- KPIs and measures are not fully understood by all of those using them
- KPIs and measures are poorly documented
- The documentation that does exist is almost unreadable
Performance measurement and performance improvement are two peas in the same pod. One powerful process improvement approach, borrowed from the world of improvement, is the ‘Cheat sheet’ or ‘Tips Sheet’. These are simple one-page guides that tell you what you need to know on a subject or process without the long-winded approach of procedures or instruction manuals. Cheat sheets are different from KPI Definitions (which take things down to a quasi-legal level of detail).
KPI Cheat Sheets - A easier solution
Well designed cheat sheets are:
- One sheet (often an A3 printout)
- Visual, where appropriate
- Use simple language
- Well laid-out and easy to navigate
- Clarified using practical worked examples
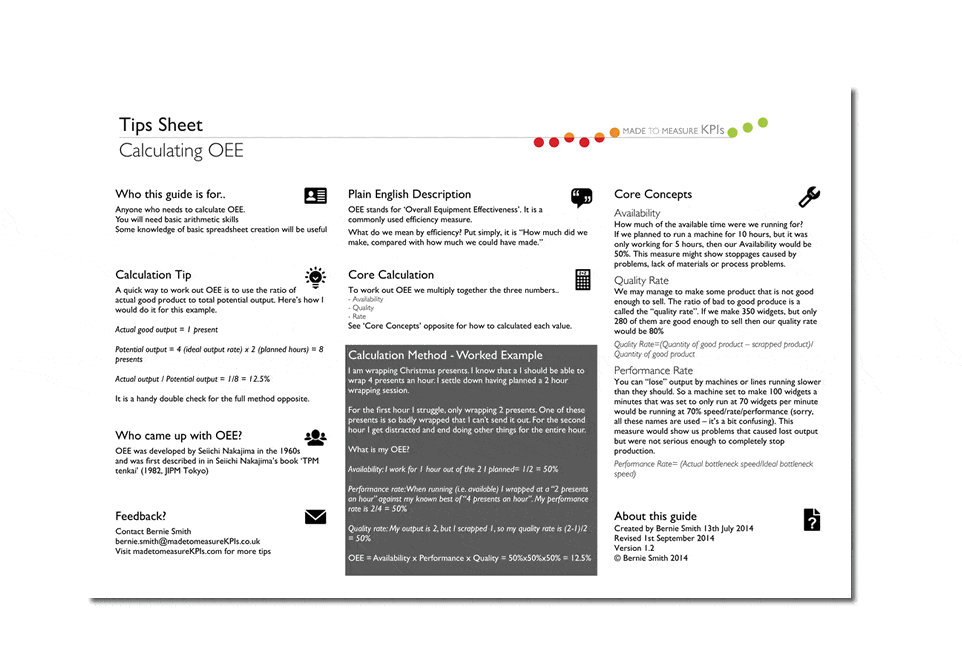
A good KPI Cheat Sheet can clear up all three problems outlined, in one go. Here’s an example KPI Cheat Sheet I created for OEE (overall equipment effectiveness) a commonly used efficiency measure in manufacturing operations that can give us a clear understanding of machine performance versus potential, manufacturing productivity and is the cornerstone KPI for an OEE KPI Dashboard (head here for a free sample Excel dashboard). A good understanding of the underlying calculation is critical when it comes to analyzing OEE data and making informed decisions.

Here's a link to download a more print-friendly PDF version.
The key thing with a cheat sheet is that it is useful and accurate.
KPI Cheat Sheet Template - Field Descriptions
| Feature | Description |
|---|---|
| Purpose? | What the Cheat Sheet is support to help you cheat at. |
| Pre-requisites | What you need to know. Systems or software you need to have access to. |
| Plain English description | A non-technical outline of how the measure/KPI works. |
| Core calculation | The guts of the calculation including the maths/formula. |
| Tips | Stuff that will make it quicker, or help you avoid pitfalls and errors. |
| Worked example | Step-by-step example with real values |
| Core concepts | If a KPI has non-obvious concepts these may need further explanation. Doing this outside of the Core Calculation helps prevent the reader being overloaded. |
| Who to feedback to | If there are mistakes, update or queries, documenting this makes it easier for the reader to get in touch with the named owner. |
| Version number, date etc. | Helps prevent embarassing gaffes where someone is using and out-of-date or obsolete version of your lovely KPI Cheat Sheet |
| Screen grabs | Pictures and illustrations can make things much clearer, easier to understand and help prevent misunderstandings. |
| Icons | Clean, simple icons can help users navigate the page quickly, easily and with minimal mental exertion. The power of icons increases if the reader is a regular user and becomes familiar with them, and their meaning. |
If you have any other questions, remember the principle that above all a cheat sheet should be useful and accurate.
Download your own KPI template for the price of a coffee
Ready to have a go at creating your own? Need a blank template? Buy me a coffee and you can download it in a bundle of three formats - Visio (MS Windows), Excel (MS Windows and OSX) and OmniGraffle (OSX).
Download the KPI Cheat Sheet template set now:


![Complete Guide to the OKR Framework: How to Create OKRs for Your Team [2024] okr kpis and targets logo](https://madetomeasurekpis.com/wp-content/uploads/2021/12/okr-kpis-and-targets-logo@2x-150x150.png)
