Tibco Spotfire 4.5 Hands-On Review
What is Spotfire?
Spotfire is a BI (business intelligence) tool that enables you to explore and represent "big data" sets. It's one of a class of tools that focus on making it easy to explore masses of data without being a database ninja. It's head-to-head with tools like Tableau and Qlikview. I'd previously been put off trying Spotfire partly because Tibco had a head-spinning number of industry-specific variants and I had no idea where to start. Thankfully they have simplified their product range to one product, with variants of funtionality based on how much you are prepared to pay. This is a review based on my personal experiences over the last few weeks of using Spotfire, so I'm not going to comprehensively review all the feature set, just those that I have used and found noteworthy. So is Spotfire the solution to your data analysis hassles?
User interface - what's it like to drive?
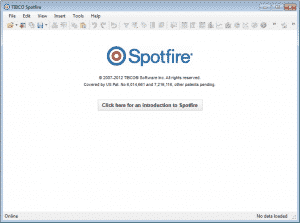
Spotfire's interface is a teeny bit introverted. It has a clean simple interface that really doesn't let you know what delights lie within. Unlike a package like Tableau, which has plenty of "user interface bling", much of the functionality is tucked away in property dialogs that you need to call up with a right mouse click. So you are presented with pretty plain interface. There's a big button in the blank workspace that will take you to Spotfires introductory tutorial (well worth checking out, but pretty brief).
Getting data into Spotfire
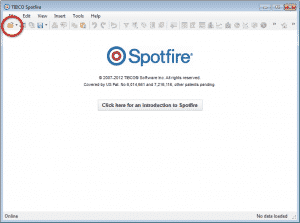
The first thing to do is to open the data you intend to analyse. For Excel data this is a doddle, just go to the little folder icon and open your spreadsheet.
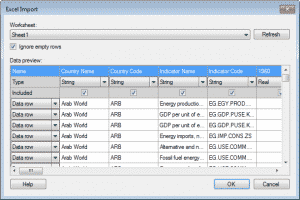
You will be asked which tabs you want to import and which columns. Intuitive and simple...
Opening data from a database is a little more convoluted (by necessity) requiring details of the database and of the SQL query you would like to run.
Analysing data
It can take a while to import the data into Spotfire (a couple of minutes for my query to a 15GB SQL database) but this may be more a function of my database server than Spotfire. It took about 35 seconds to open a 80MB, 800,000 (30 columns) row spreadsheet.
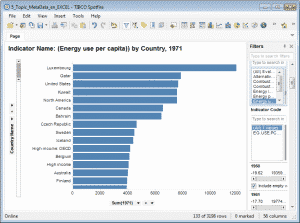
Once the data is imported you are ready to start analysing the data. Filters give you lots of flexibility about which data you include or exclude. You just select your chart (or table) type from the icons at the top and drag and drop your data into the chart. If you have used pivot tables it's a similar routine. This is the bit that makes you go "wow". The charts refresh almost instantly. You then fine-tune your analysis by telling it what type of aggregation you want (for example count, sum, median etc.) You do this by clicking the little arrow on the axis label.
You can nest the axis, so have "months" with"day of month" nested within it. Because of the way Spotfire handles dates there is pretty much complete flexibility with how you structure time axes (it splits dates out in numerous ways, allowing you to mix-and-match those elements).
You can do just the same process with tables as well, or mix and match charts and tables with a "Graphical Table" that allows you to drop Sparklines or Bullet charts in cells next to the data - very nice.
Laying out charts and tables - working your dashboard magic
Once you have created your first chart, chances are you will create another. You have two options, either drop another on the same sheet - building a dashboard, or you create another "tab" with your new analysis on. If you put more than one chart on a tabbed page you can use the buttons on the toolbar to arrange them or just manually drag the border to resize the windows. You can add text or data windows onto the same page.
Filters - your new best friend - if you can work them out
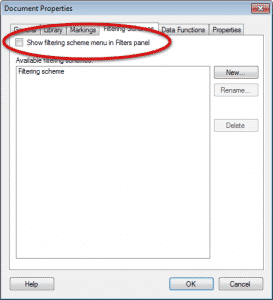
Filters are really important in Spotfire. They enable you to choose which data you are going to show from a given column, allowing you to exclude certain data (just like filters in Excel, but a bit more elegant). Maybe I'm a bit stupid, but I was surprised that changing the filter on one page affected every other tab in the workbook. After a little Googling I discovered that filters don't apply to just the page you set them on. You need to create a new filter and then apply it. This isn't very intuitive as the "Show filtering scheme" option is turned off by default, you need to go into "Document properties" then select the "Filtering Scheme" tab to turn it on - not very obvious at all. Once you have worked this out, filters and simple and easy to use.
Calculated Columns - super handy feature for all your calculation needs
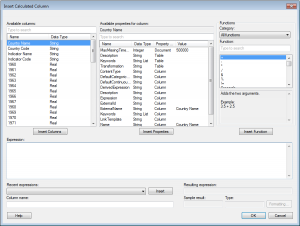
There's almost certainly a lot more functionality buried in Spotfire, but one feature I found myself using was "calculated columns". Let's say you have columns called "weight" and "height" and you wanted to have "Body mass index" (kg/(height squared)) you would go Insert>Calculated Column. You are presented with a page that enables you to build an expression based on available columns, available column properties and a list of possible functions.
When you are done building your expression you give your column a name before clicking "OK". It's simple enough that I didn't need to look at the documentation once - perfect.
Visualisation of data - charts, graphs and other bling
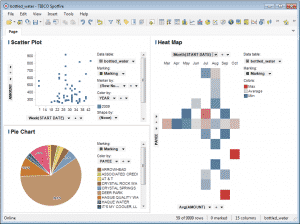
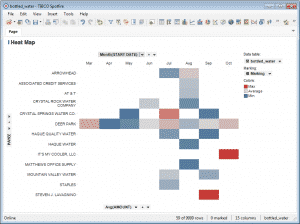
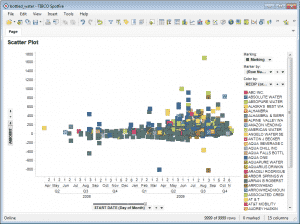
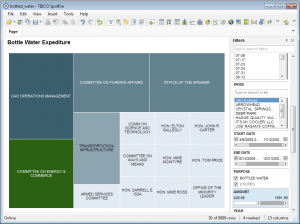
I have simple tastes when it comes to representing data, rarely branching out past column, line and scatter plots. Spotfire has a good selection of ways of plotting data, including heatmaps, maps, treemaps and all the usual suspects. Here are a selection of examples....
When appropriate, there are lost of options to vary marker size, colour and even shape based on data. It's best not to get carried away with this but it can allow you to squeeze some vital extra data onto your visualizations.
Likes
With the exception of intially loading the data set, Spotfire pounded through the analysis I threw at it. One of the data sets was a 15GB SQL database, another was a 800k line Excel workbook. It returned the analysis almost instantly in both cases. Jaws dropped as my colleages (used to Excel) saw the speed and ease of cutting data. As one of my team said "That tool would completely have replaced my job at the last bank I worked at!"
There seems to be good forum support, most queries you have can be resolved with a couple of minutes Google research.
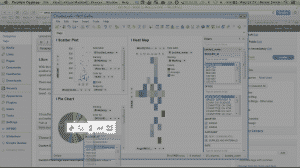
There are some real time-savers, like the ability to import and export corporate colour schemes. You can also drag and drop data, with clever - icon based - targets that let you determine how the dragged data is used, like this....
It handles things like dates brilliantly, breaking them down into any combination of day, week, month, quarter, day of week. It's a breath of fresh air and makes periodic analysis really simple.
It is wonderfully fast, at least on the data set I used.
Confused by
- Things such as changing the order of data series can be a bit non-intuitive.
- Filters can take a little figuring out, but are very straightforward once you understand how to set them up and switch between them.
- Changing the colour scheme is also not very intuitive, but a huge time saver in a corporate environment once you have figured it out.
- Refreshing data when a spreadsheet changes.
Dislikes
PowerPoint slide export has the potential for greatness but is let down by it's execution. The exported slides are a bit of a mess, with both images and text a bit too large and badly laid out. You will end up having to hand tweak each slide. I guess Tibco expect users to serve up their dashboards over the corporate intranet but in reality most of my clients still function of the PowerPoint-Email distribution system. I didn't have the opportunity to test it's ability to serve up analysis as web pages, but I think it's quite a big part of Spotfire's feature set.
The other irritating aspect of the package is the way that axes are labelled. They are logically labelled based on the data source (e.g. Record Count) and the aggregation type (e.g Unique Count). This is all handled automatically and is fine most of the time, as long as you don't mind axes with labels like "Unique Count(Record Count)". If you want to "fine tune" the labels for the "sensitive senior exec types" of customer you will find yourself fiddling about in PowerPoint trying to overlay a text box with the revised label over the top of the image from Spotfire. Not great when you are in a hurry.
Some of the spreadsheets I tried to connect to managed to choke Spotfire (and not through their size, the problematic ones were tiny) - necessitating a trip to Task Manager to kill the program. After a quick copy>paste special>paste values and format into a new sheet and everything seemed to work OK. Workeable but very tedious when there are lots of revisions going on. It may not be a Spotfire issue, but Excel had no issues opening and editing these workbooks.
Verdict
Using Spotfire you get the feeling that someone finally got fed up with messing around with Excel and Pivot tables and decided to implement that approach, but properly.
The whole tool feels nicely focussed around cutting, analysing and displaying data. It doesn't try to spread itself too thinly and really succeeds at what it sets out to do. One example of this focus would be on scatter plots. I needed to plot a number of points that were nearly co-incident. Spotfire has a dedicated "jitter" control that will jiggle the points about (with the ability to vary the "jitter" amplitude), so you can sacrifice precision for readiblity - brilliant!
Where I found myself getting a bit frustrated was in trying to fine-tune some of the appearance options. For example, on my scatter plot you can label the points, but the only thing you can change on the labels is the font size. You are stuck with a crude enclosing box, no choice on background or on the colour or weight of lead-line to the point.
Part of the reason these minor formatting issues grate is that the rest of the workflow with Spotfire is a delight. Once you have got into the way the package works (a couple of days of light use and you should be there) it is a joy to use. It is fast, logical and flexible. If you find yourself regularly using pivot tables, producing lots of charts or creating dashboards in Excel you really owe it to you (or your team) to check this tool out, it could transform the way you produce analysis.
Trying Spotfire out - getting a free trial
You can try Spotfire out by visiting their site here. You get 2 weeks of the full product and after this it drops back to the "personal edition" which drops a number of the more useful chart types, the abilty to export to PowerPoint and connections to databases (limits you to Excel spreadsheets).
Disclosure
I didn't get paid a bean to write this article - just so you know.
Version tested 4.5.0.33
If you like the idea of a swanky BI tool, like Spotfire, but know that your boss won't stump up the cash (or IT will make it take 18 months to happen) you might be interested in stretching Excel to deliver surprisingly good reports and dashboards. I've written a (very down-to-earth) book on how to do this, called BlinkReporting. Click on the advert below to check it out. It's great if you need a step-by-step guide to getting some brilliant looking Excel reports out the door in double quick time.

