Using KPIs to improve your business
I’m often asked how to create KPIs and measures. It’s not a short process, which is why most people end up brainstorming or using existing measures when they are tasked with doing this (check out this article – Six KPI Selection Traps to Avoid to see some of the other pitfalls). The good news is that it is a repeatable process. Here are the key steps in coming up with a new KPI or measure that will drive your organisation towards its strategic objectives…
Agreeing what we are trying to achieve with our KPI measurement
Review Strategy documentation. Make sure you understand not just the words of the document but the ideas behind it.
Identify strategic objectives. It can be hard to translate strategy into something more granular but very often a business strategy document will have clear strategic objectives. These objectives can make a great starting point for defining our measures.
Do you know what questions you are trying to answer? Without knowing what question you are trying to answer you will only pick the right measures by accident. If you can’t identify the question you really shouldn’t go on to the next step until you can answer it, however tempting. What are you trying to achieve with your KPI measurement?
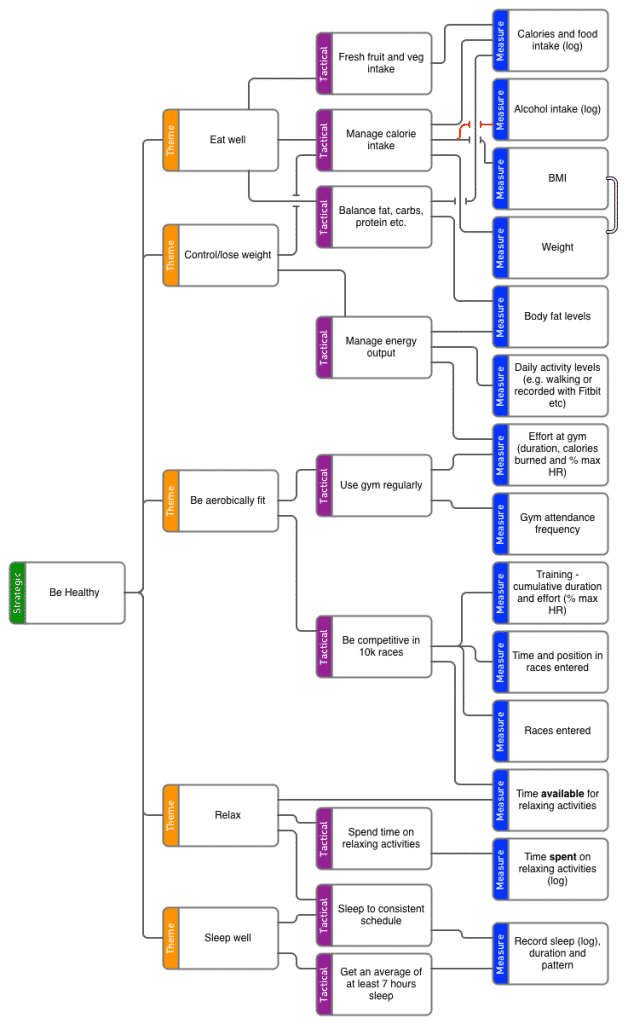
Cascade strategic objectives into measurable quantities. There are a number of techniques for doing this, I use a method called “results mapping”. Whatever technique you use, by the end of it you should have a visual representation showing how your measure or KPI connects to your strategic objective. This is often done through layers of intermediate results or outcomes. Run a series of “Results Mapping” workshops with SMEs and stakeholders. Here’s an example based around a person strategic objective of “being healthy”…
Engage stakeholders and understand our situation
Identify key stakeholders and subject matter experts. There are two very good reasons and for engaging key stakeholders and subject matter experts. Firstly they know a lot. Secondly, they are much more likely to agree with the outcomes and findings if they’re involved in the process of deciding them!
Train stakeholders and SMEs in BlinkReporting approach. One of the approaches I teach clients is to clearly represent data and information using the BlinkReporting approach. Training up people in this approach early on brings a fantastic level of buy-in from stakeholders.
Review existing reports and dashboards. Go through existing reports and dashboards and critically analyse what is successful or unsuccessful about them. Better still, get the key stakeholders and subject matter experts to critique them.
Create the measures “longlist”
Create draft “results map”. Using your preferred method for mapping strategy into measures or KPIs you should come up with a long list of potential measures or KPIs. It is often worth refining or polishing this long list by meeting up again with your SMEs or key stakeholders.
Keep revising your results map and long list until you build consensus and agreement amongst your stakeholders and SMEs.
Workshop importance/ease-of-capture matrix. When you have a long list then it is time to rationalise that list. You can do this using a simple 2 x 2 matrix. On the X axis you have two categories, able to gather and hard/not able to gather. On the Y axis you have two categories, important and trivial.
The matrix will look something like this…
Agree “use, aspire or discard” list. From this you can easily create a “priority” category and an “aspire” category. The priority category contains those measures which coincide with “able to gather” and “important”. The “aspire” category includes those measures and KPIs which fall into the “important” category but also the “hard/not able to gather” category.
Set up new measures
Develop the actions plans for “use” and “aspire” lists. Using action lists and project plans you can create a programme for implementing new measures or collating existing ones.
Design dashboards and reports
Identify report stakeholders and TOR for use. Terms of reference set the context for use of the report. Having good terms of reference enable you to justify the content and structure of your report. Without this context it becomes easy for people to tear into the design decisions and choices you have made.
Properly define measures and KPIs. Having your measures properly defined increases confidence in those measures and the reliability of the outputs. See this KPI Definition checklist for step-by-step instructions on how to do this.
Go live with agreed dashboard or reports. Get your measures up and running as swiftly as possible. You won’t achieve perfection first time, so you need to make sure that you respond to feedback and criticism politely and quickly.
Prototype the dashboards. When your measures are in place then you can start to pull together proposed dashboards. It makes sense for these proposals to be in draft form, so you can easily change them based on user feedback. Visio can be a useful tool for creating mockups quickly.
Review the prototype proposals with live revision session. If you can, get your stakeholders in a room and make changes to the draft dashboards in real time. This can save a huge amount of to-ing and fro-ing on the approval process. If you can’t get a live session together then you will need to go through a formal approval process. This will normally involve multiple emails and formal agreement from a predefined list of stakeholders.
Once you have sponsor approval…
Go live with agreed dashboard/report
Produce dashboard/report. Think carefully about the production process.Initially production will normally involve lots of copying and pasting in and out of Excel. It’s worth looking at existing business intelligence tools you may have, such as Business Objects, Cognos or Tableau and seeing what scope for automation there is.
Issue first production version of report. Get the first report out as soon as possible. If you don’t do this you can find the organizational enthusiasm withers and dies before the first report ever makes it out into the light of day.
Actively seek user feedback and tweaks. Perceived intransigence can also damage the reputation of an MI department or of a specific report or dashboard. Take feedback on board quickly and courteously.
Revise and refine dashboard throughout “nursery period”. Keep up the support for pre-agreed nursery period. It is this stage in the process that will often have biggest impact on success or otherwise of a report or dashboard, so make sure you don’t skimp on it.
Don’t forget KPI measurement can sometime attract criticism because of what it shows, but this will often show itself as criticism the system. Try and separate the two to avoid a fruitless debate.
Hand over to “business as usual team” and head to the bar…


Quite instructive, look onward to coming back again.
Hi Claudia, you could try my LinkedIn Groups, Performance Measurement and Lean Offices. Let me know if you have any specific questions and I’ll help if I can. Bernie