


Report Your KPIs

What Are Terms of Reference? (Free Terms of Reference Template)
We answer what are terms of reference, why they matter for meetings, and how they connect to reports & dashboards. Free download: terms of reference template.

Dashboard Design Checklist for Better BI (54 check points!)
Make your reports easier to read, nicer to look at, and more useful. Let’s be honest-most KPI reports are either a hot mess or just plain dull. If you’ve ever looked at your own report and thought, “Why isn’t this working?”… this is for you. What Is the Dashboard Design Checklist? It’s a comprehensive list…
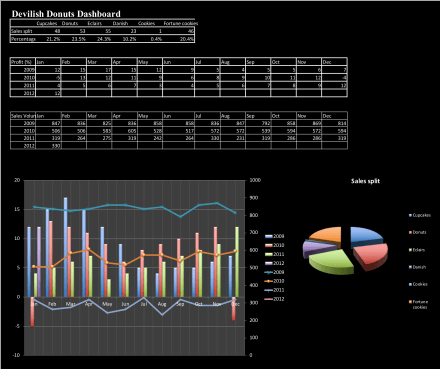
5 Common Dashboard Design Mistakes (and How to Fix Them)
How many of us have been here: you’ve spent hours building a dashboard. You’ve pulled in all the latest numbers, added data visualisation, polished it up, and shared it with your team. And then… chaos. Stakeholders are firing questions left, right, and centre: “Wait, what does this chart mean?” “Why is this important?” “Are we…

The worst Excel user ever?
At the start of my career, I worked with someone who used to moan ALL the time about how terrible Excel was. After weeks of complaints, I decided to see if I could help, just to stop the complaining. I sat down next to him and quickly discovered he was using the ‘shapes and lines’…

Choosing the best reporting tool for your KPIs
The chances are your preferred tool for managing your KPIs will be a spreadsheet. Whilst spreadsheets are a good solution for many, it’s worth remembering that there are alternative options for recording, displaying and managing performance data. For certain situations, one of these alternatives may be the best reporting tool for your organisation. Here’s a…
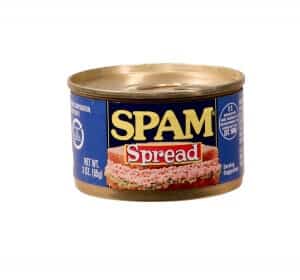
Report Engagement, 10 essential lessons from spam email
I hate spam, so I am reading a book on marketing emails (Email Marketing Rules: A Step by Step Guide to the Best Practices that Power Marketing Success by Chad White) to figure out how to create engaging emails that people actually want to read and open. Reading the list I realised these rules hold…

Assessing Report Design Objectively – Avoiding Fights
There are three situations where it can be a good idea to have a structured review of your reports and dashboards… If some of your team are in denial about the need to change existing reports You want some clear ideas on what needs to be included in improved dashboards or reports You have an…

Improved KPI reports by understanding thumbs
There’s a very interesting article in the Guardian on mobile software design for the real world. One of the points they make is, through watching phone users, the authors of Polar have established that 49% of users drive their phone apps with just one thumb. This is interesting to the app designers for all kinds…

Using 5S to improve report and dashboard design
5S is a tool that lots of manufacturing businesses use. It’s a funny tool as it can look quite superficial unless you have been involved in a project where it has been applied properly. What people often miss is the mindset that goes along with it. When you start living and breathing 5S some quite…
KPI report design checklist. How good are your reports?
Introducing the KPI Design Report Checklist You may be trying to work out why your current reports aren’t working properly or wondering if you missed anything on your newly created masterpiece. This design checklist encourages you to consider each element of your design and to score it if you are feeling brave. You can use…