


Refresh

How to measure the “unmeasurable”
I’m often told that some things are impossible to measure. It’s true that some things are much less obvious, but there are some pretty ingenious ways around this. If you can’t measure something directly then you can look for “coincident” events or activities. What am I gibbering on about? Let me give you an example:…
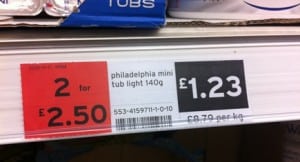
Bargains galore…
I’m sad. I take photo’s in Sainsbury’s, but these price tickets just made me smile!
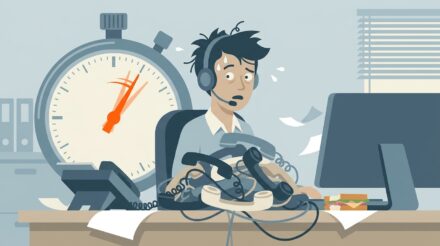
Why that call centre wants to get you off the phone…
We have all been hurried off the phone by a call centre. Have you ever wondered what made that happen?
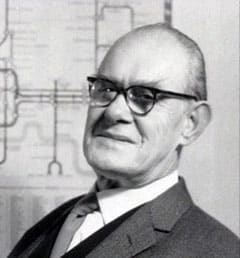
When to leave things out and ignore people….
Sometimes things jar when you first see them. I see this a lot with dashboards that I help design (or redesign). People become very wedded to the look – but more crucially they are wedded to the logic of how something is laid out. I think a brilliant example of this is the modern tube…
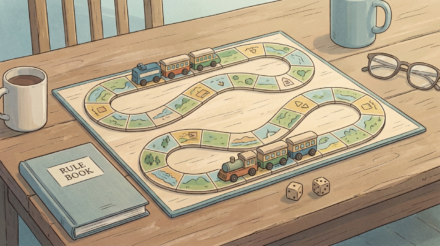
Loo’s, trains and board games
How does measuring fare revenue lead to a five year old wetting himself?
- « Previous
- 1
- …
- 9
- 10
- 11